Cross posted from Charlotte Research Scholars blog.
The goal of our research this summer is to explore the possible correlations between lightning frequencies below 40˚N and above 40˚N in the boreal regions of Canada. We are using 15 years of lightning data measured from instruments on NASA satellites.
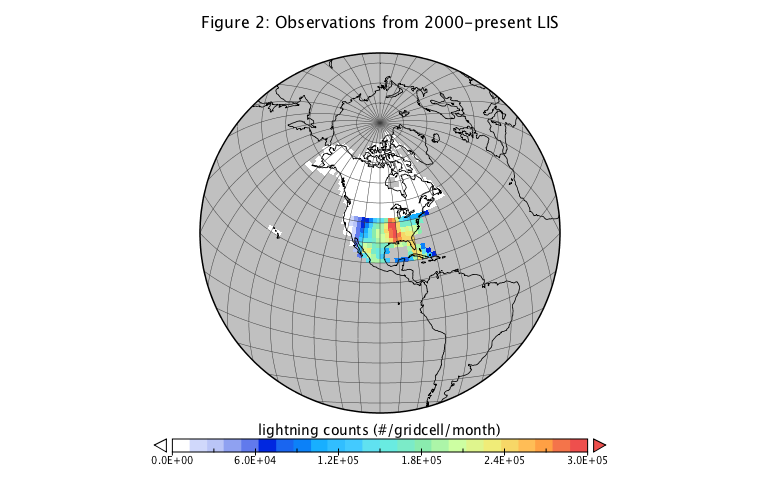
During the first two weeks of the program I read journal articles related to the satellite instruments and learned about different ways to explore large datasets. I learned how to use a program called Panoply to study the full 15 years of data (Figures 1-2 are from Panoply), and am now learning about MatLab, a program that can be used to calculate statistics for large datasets. Devoted global lightning observation began in 1995 with the Optical Transient Detector (OTD) aboard the MicroLab-1 satellite (Figure 1), but this detector fell out of orbit in 2000.
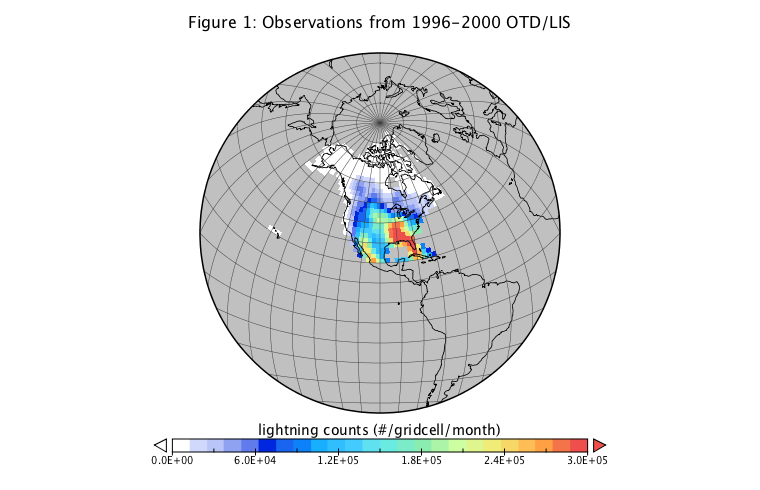
A second lightning detector, called the Lightning Imager Sensor (LIS) on the Tropical Rainfall Measurement Mission (TRMM) satellite, has been collecting data since 1998 and is still in operation. LIS collects lightning data between 40˚S and 40˚N (Figure 2). As a result, there is a gap in the data above 40˚N after 2000, which can be seen by comparing Figures 1 and 2.
Using MatLab, I hope to determine whether correlations exist between the latitudes with data from 1996-present and the latitudes with data from 1996-2000. I can then use the statistical relationships to extrapolate the dataset beyond the year 2000.
— Daniel Cunningham