Scientists studying the Earth’s climate system are supported by an immense and rich array of data. Sometimes it seems like you only have to be comfortable working with all this information. Programming languages help (matlab, R, python, NCL, for example). But even more accessible are incredible web resources. The USA High Plains Regional Climate Center updates their climate and weather relevant maps on a daily basis. Here are some figures showing where the country and the southeast USA stands. From NCDC time series plotter, the contiguous USA (no Alaska and Hawaii) was the 37th warmest year in the last 119 years, as shown in the graph below.
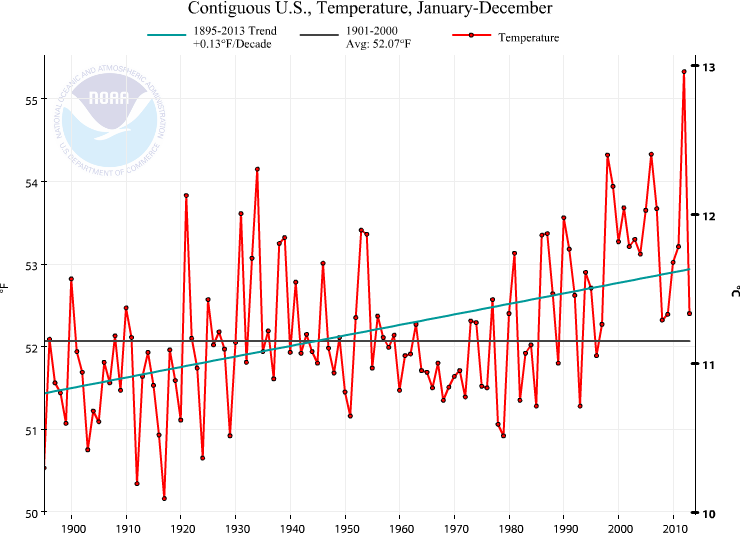
In itself, 2013 wasn’t unusual. In recent memory, 2008 and 2009 were really similar to 2013. However, compared to the fanfare around the hottest year on record for the USA in 2012, it does seem different. Who can remember ought-8 and ought-9, right?
But even more to the point is what we feel where we live. Science and statistics are fine, but just like no one on Earth experiences the average global temperature, no one in the USA experiences the average USA temperature either! Let’s look at the Southeast. In 2013, drawing from the HPRCC link above for the figures below, the temperatures were cooler than average.
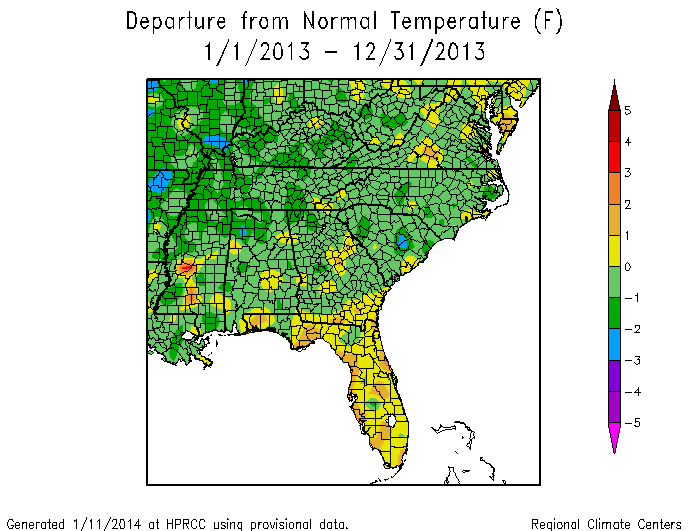
In the last 120 years, 2013 in the Southeast was about the 67th warmest. Most of the years in the past 120 years have been warmer! But this is really not that ususual. 4 of the last 10 years in the Southeast have been cooler than more than half the past 120 years. 10 years is a limited view, but I chose it because it’s a round number and because we remember the last 10 years. Going back to the USA, *none* of the last 10 years have been cooler than more than half of the past 120 years. Not really even close. You can verify this with NCDC data tools. What global warming? Well, that’s where perception matters. The Earth is warming, even if the Southeast seems to be avoiding the problem we’ve created with CO2 emissions.
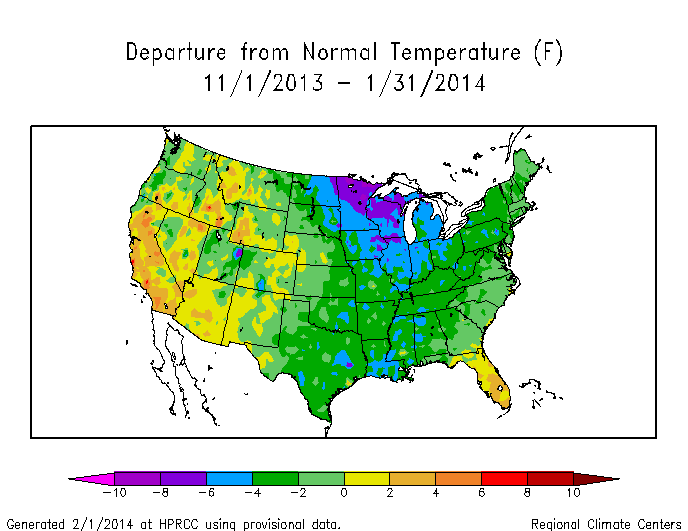
Looking to the more recent period, we can also glean a little bit about our winter months with a 3 month average (Nov-Dec-Jan) using HPRCC again
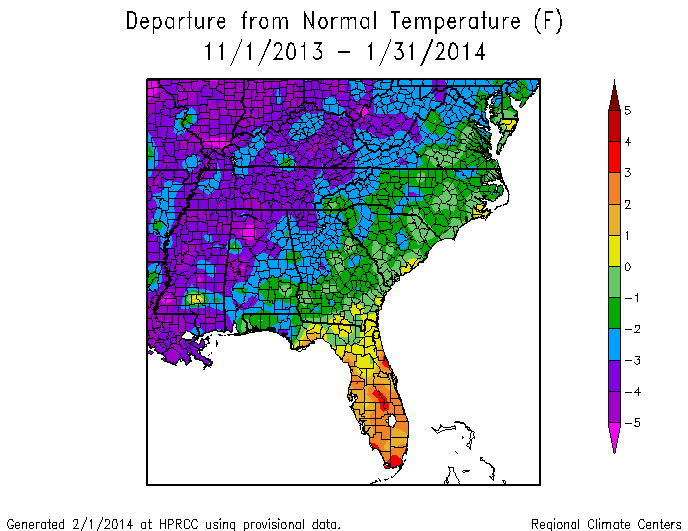
We see that except for Florida, the Southeast is largely cooler than average. Here HPRCC is comparing against the 1981-2010 average temperature (temperature anomaly). Appalachia and further to the west are in a deep recession of the warmth we expect when we think of global warming.
Finally, we can look at January 2014 using HPRCC tools.
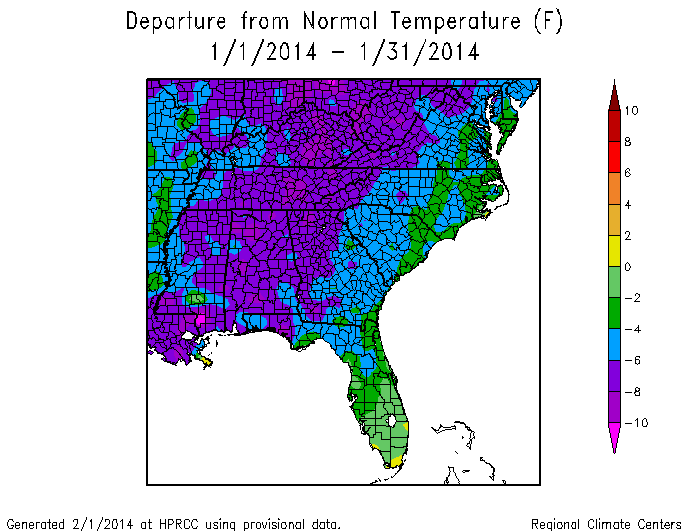
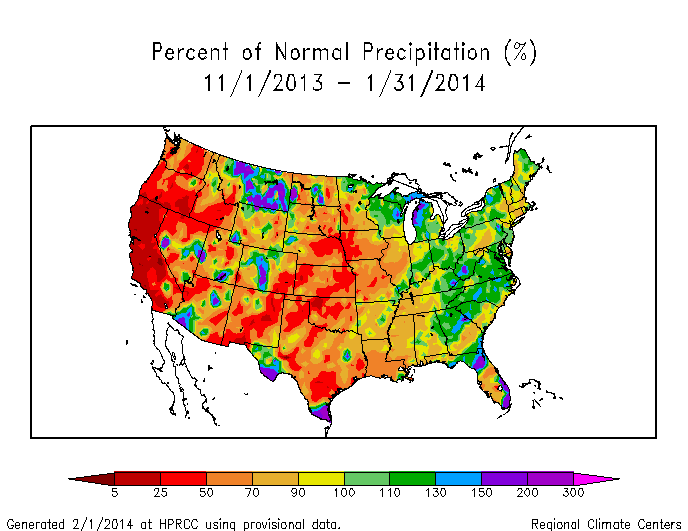
The Southeast is cold! Even poor Florida, which over the last 3 months is anomalously warm compared to the rest of the Southeast, is in a deep cold this past January. If we eyeball-average the data on the figure, we get a number of about 6-7 degrees F below the 1981-2010 average. Jeez. Where can we go for unseasonable warmth (retrospectively)? The West is certainly above average, and more importantly below average on precipitation, as the figures show below.
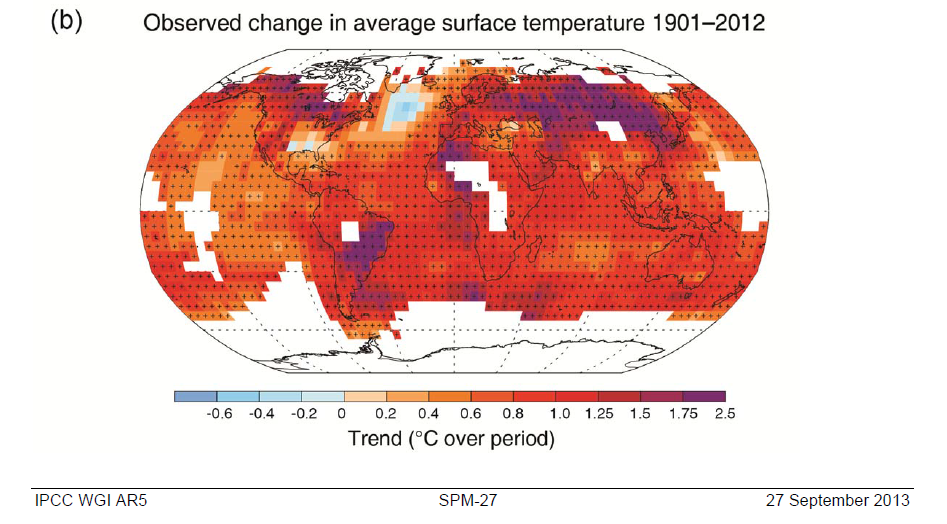
Be thankful the Southeast is so stubbornly refusing to budge on global warming… but I worry that as a result of this stubborness, our legislators will forget this is a problem. North Carolina will be affected even if we are a hold out for now. Think global whenever you think of climate. Or, if you want, think of Bob Marley (one love, one heart). This figure from the recent IPCC report (WGIAR5-SPM_Approved27Sep2013) shows that there are only a couple of non-red areas on Earth (ie. they are not following the warming trend). The Southeast is one of them! But that is one scorched Earth otherwise.