Where we are this calendar year
Currently, the USA as a whole and the Southeastern USA are both cooler than normal this year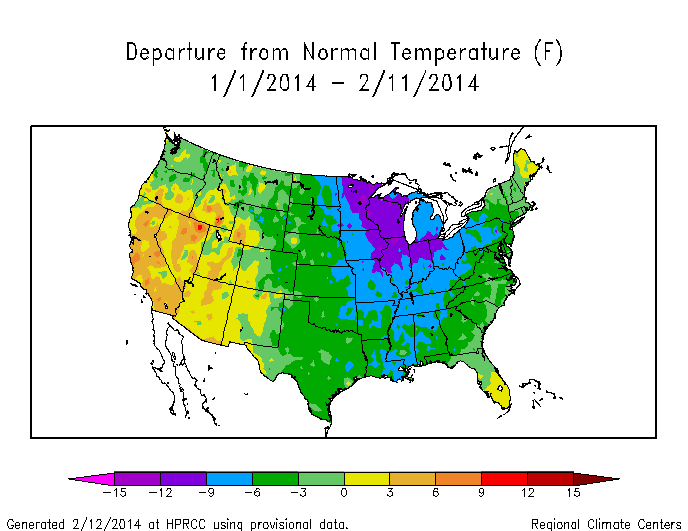 and precipitation is slightly below average for the Eastern USA, above average for Colorado-Wyoming-Idaho, and well below average for the Southwestern USA.
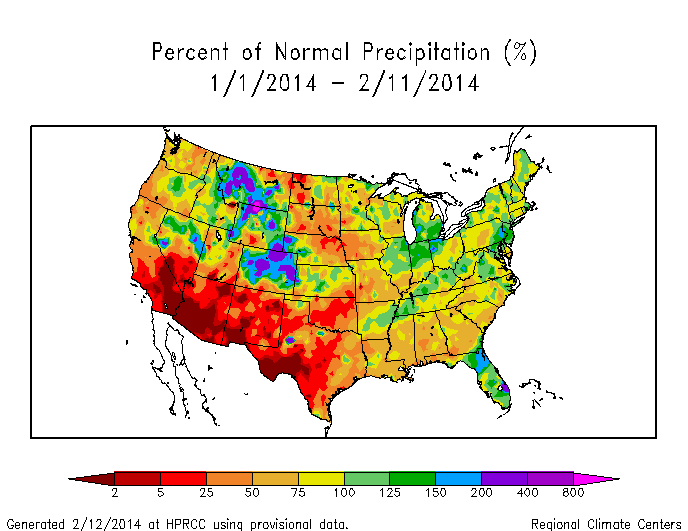
Where we are right now
Thinking about the upcoming year in weather while in the midst of a crippling snow/ice storm in the Carolinas (discussion via #NWSGSP, over 2,000 outages by end of 12 Feb 2014 mostly in Lancaster, Greenville, and Pickens Counties in SC, and Macon and Caswell Counties in NC*, flights cancelled, Rayleigh-Durham turning into a parking lot like Atlanta only two weeks ago, etc.) is the perfect time to test whether you can separate a trend from variability (teach me, dog walker).*updated on 13 Feb 2014 midday is 36,400 outages; more than 14,000 in Mecklenburg, 4000 in Cabarrus, 2700 in Gaston, 1600 in Rowan, 1300 in Lincoln, and 1100 in Durham County, NC. About 5000 in Lancaster and 2900 in Chester County, SC. Wow. Second band of snow falling in North Mecklenburg dropped maybe another 6″ on the 5-6″ we had yesterday. Double wow. Snow and ice totals should be impressive after the analysis is complete.
Trend, variability, and perception
The temptation is that your opinion is tempered by what you are currently experiencing. The old and boring argument that “Hey, it’s cold. What’s up with global warming?” The short-story (pun intended) is that weather is always variable, and the #SEStorm snow and ice storm is no exception.What is the trend? Globally, it’s simple. Temperature is increasing (NASA GISS, UK Met Office CRU, NOAA NCDC). For the USA, and states within the USA, it’s less simple. Variability in the weather tends to average out less and less over smaller and smaller spatial scales. What does this mean? The ups and downs we expect from weather like our February snow/ice storm and the preceding week with beautiful warm temperatures become less and less noticeable at larger spatial scales because while North Carolina might be down in temperature, somewhere else on Earth is certainly up on temperature. They average out unless there is an overriding trend, like the trend imposed by increases in greenhouse gases. That’s why the global temperature trend is so important. If something is making the entire Earth warm above what is considered a range of natural variability, then some very powerful mechanism is at work.
Where we might be this calendar year
Back to the question at hand though. Can science address near-term (say, over the next 3-12 months) temperature and precipitation? The answer is yes, and this prediction is studies using an analysis called seasonal forecasts. I was shocked by what is suggested for temperature for the rest of 2014 and slightly into the beginning of 2015. NOAA Climate Prediction Center (CPC) updates their seasonal forecasts about the middle of every month, and I put this animated version of their graphics together below. where, once you wrap your head around what I call the “geography” of the figure, you see that NOAA CPC is predicting whether the temperature over successively farther 3-month periods (Feb-Mar-Apr, Mar-Apr-May, etc.) will be above, at, or below the average temperature for 1981-2010 (the climate normal). Clearly, NOAA CPC analysis is suggesting that the USA is due to experience an above-average year for temperature. In particular, the Southwest and Alaska are pummeled by warmer-than-average temperatures until October (a hot summer in the Southwest is not pleasant, and hot summers in Alaska may be suggestive of a bad fire year). Furthermore, by about October-November, the forecast for the Southeastern USA is to be above average temperature even after the rest of the country goes to even chances for above or below-average temperature. That translates to a nice Halloween and Thanksgiving in the short-view, and yet another warm blip on the global warming trend in the long-view.*
Precipitation seems to be less interesting in terms of climatological deviations, but the Southwest does seem to at least move away from below-normal, dry conditions that are plagueing California right now.