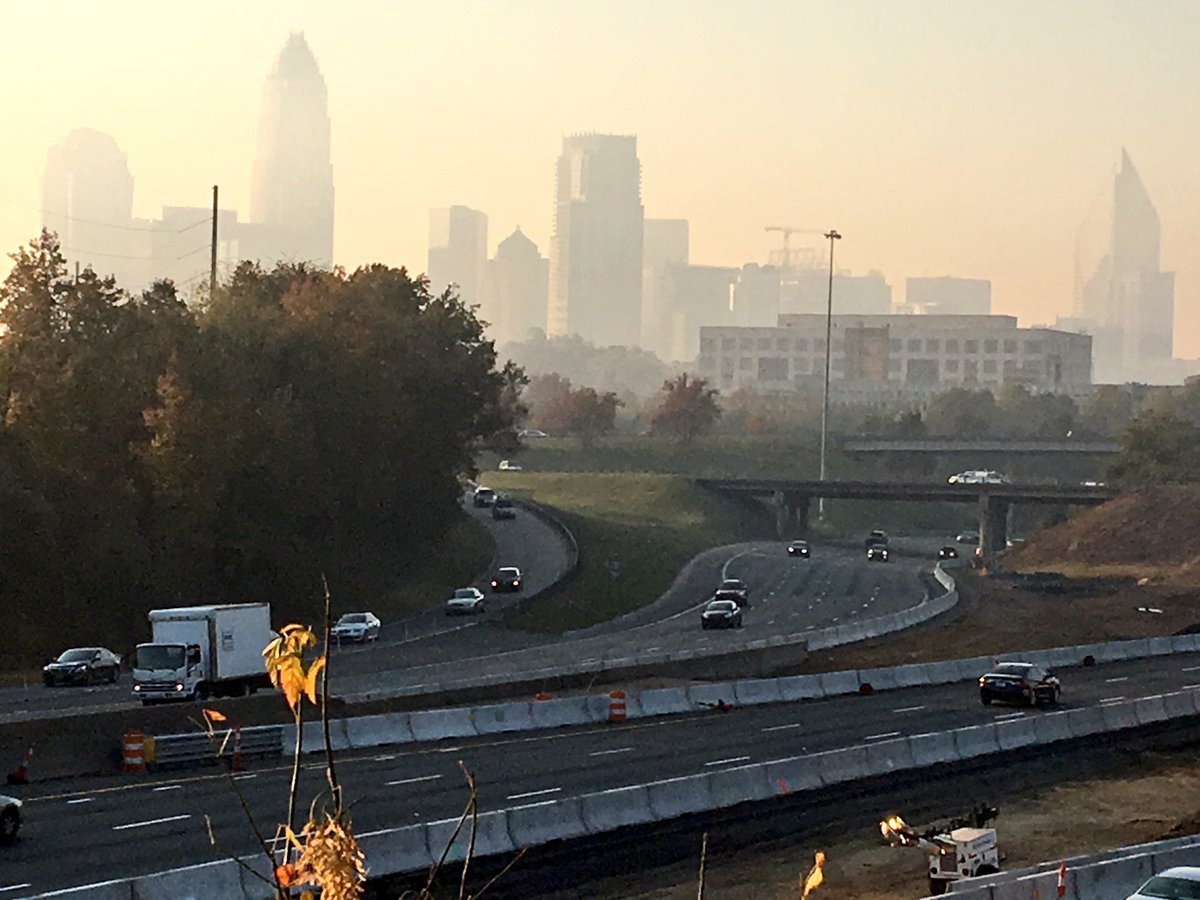
Many communities in western North Carolina and in the Queen City of Charlotte have been and continue to be impacted by smoke pollution from fires on the eastern side of the Appalachian Mountains near Lake Lure and South Mountain State Park. The smoke is moving through the near-surface atmosphere with the wind and being trapped
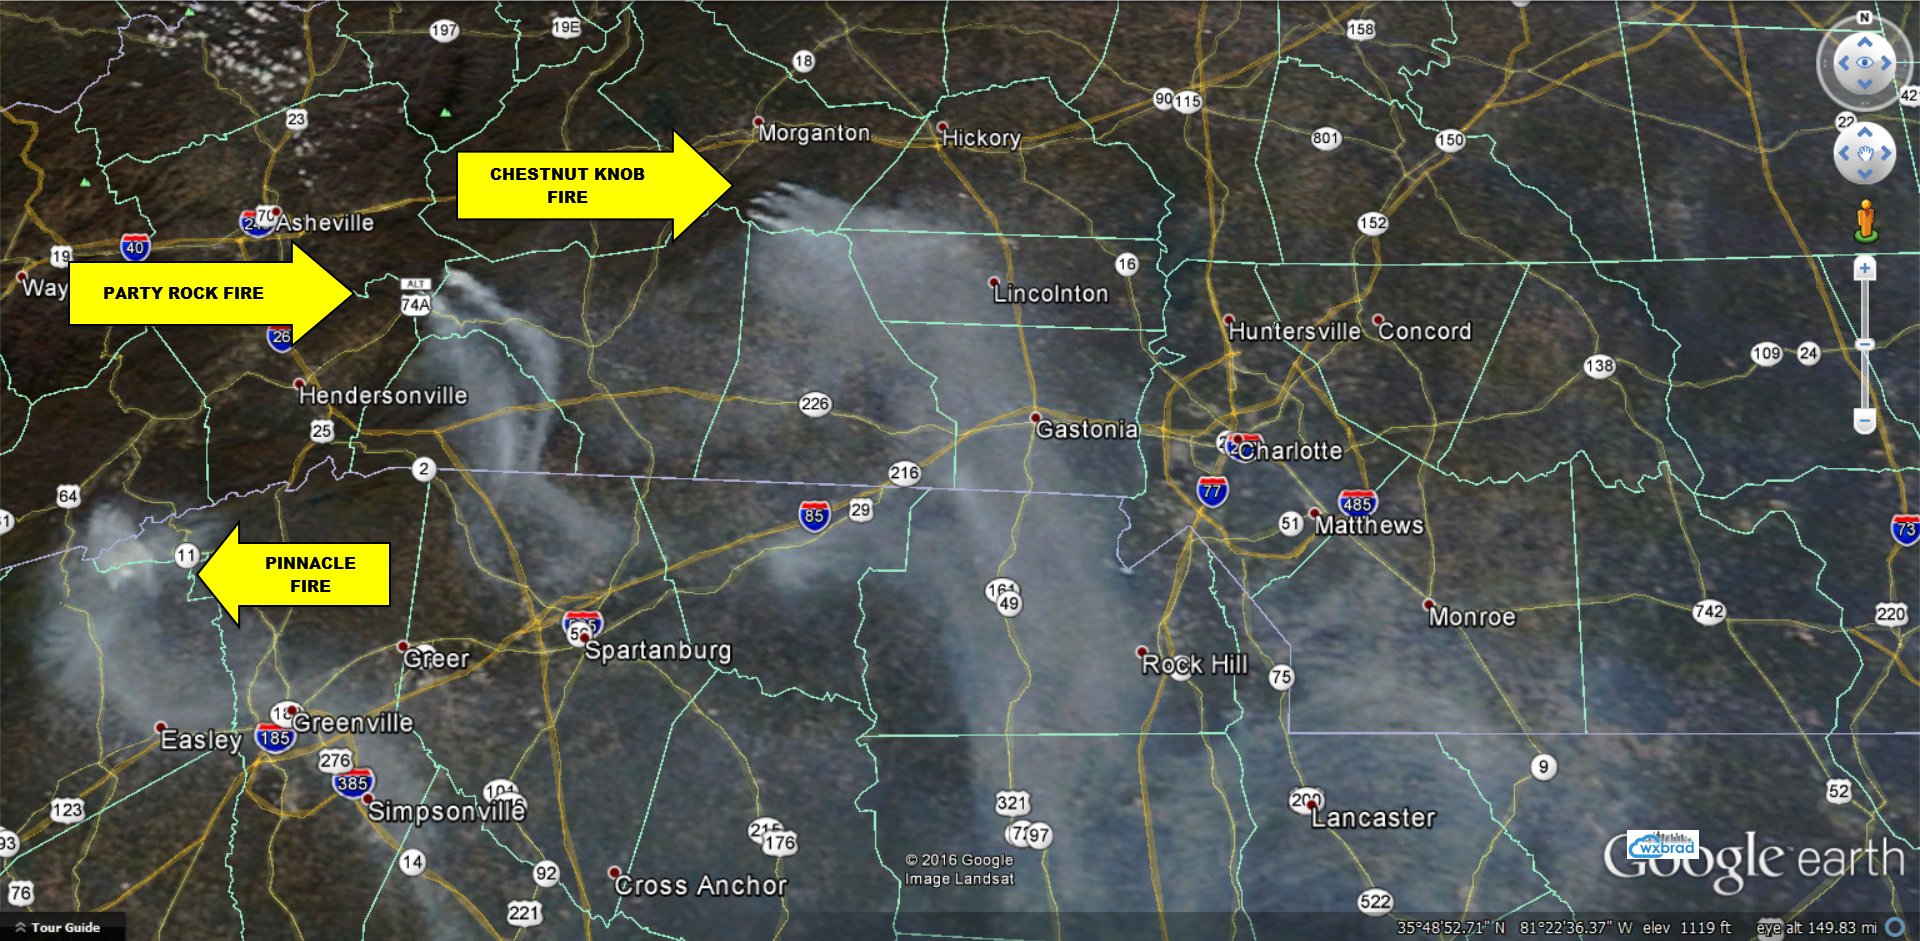
Image from the NASA MODIS sensor tweeted out by Brad Panovich at https://twitter.com/wxbrad/status/798969527417634823
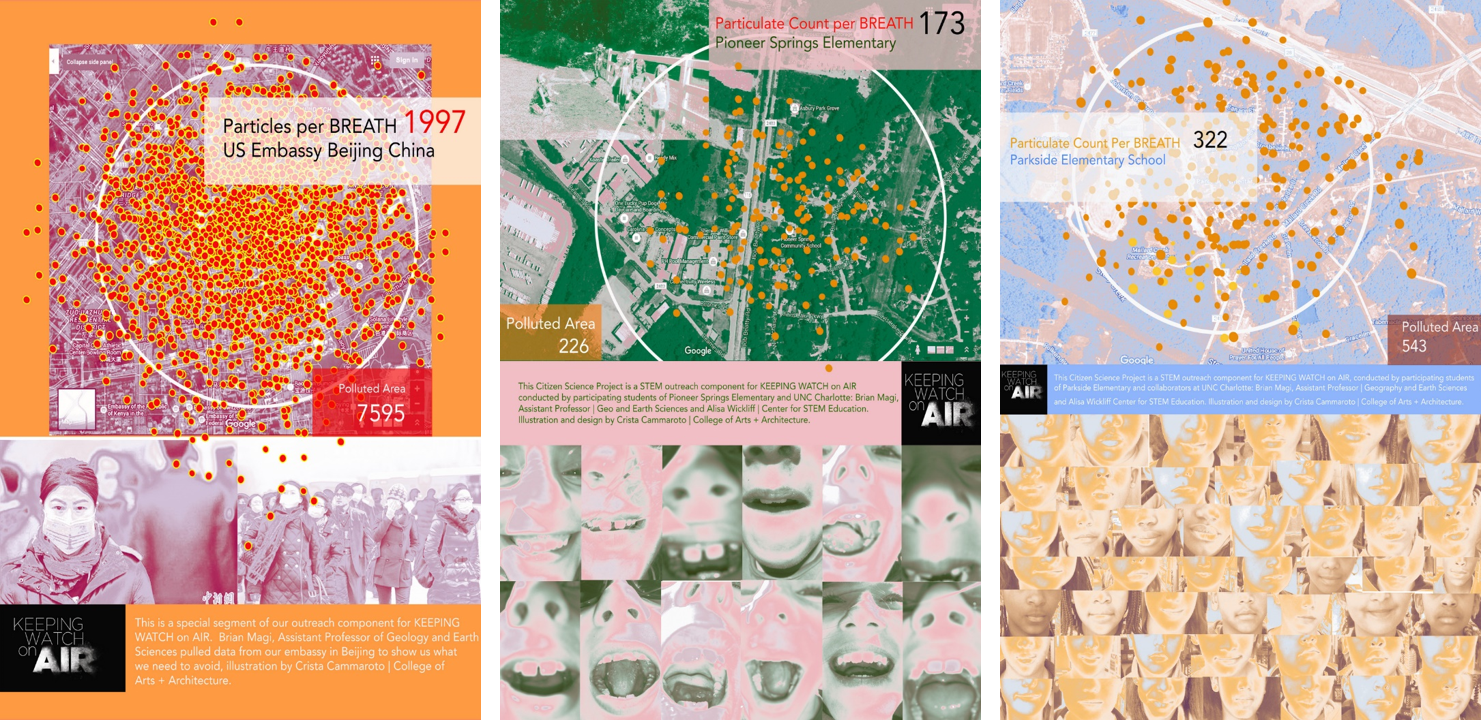
Earlier this calendar year, I worked as a part of an art-data-science initiative called Keeping Watch on Air, which was a big team of people from UNC Charlotte and Clean Air Carolina to work on how we talk about Air Quality in the Queen City. Clean Air Carolina spearheaded the Particle Falls art-science exhibition, which I hope everyone saw – it was amazing. Keeping Watch was/is a grassroots effort (no one gets paid) to bring broad expertise, stakeholders, and other agents together on a problem we all agree is important. One part of that project was an effort to figure out how to think about the air quality data scientists like me try to understand. Usually this kind of data is presented in “micrograms per cubic meter” or as an index called the Air Quality Index. I was working with Alisa Wickliff at the UNC Charlotte Center for STEM Education and a group of K-8 Teachers and Students on a science project where they collected air quality data, and I analyzed/processed it. Perfect for everyone! Crista Cammaroto (College of Arts and Architecture, Director of the Projective Eye Gallery at UNC Charlotte Center City) and I thought up a way to talk about Keeping Watch data that was in terms of something we all think about with air pollution: Particles per breath. We wanted to give people a sense of how much your body deals with in every breath, and what it looks like for polluted conditions. The posters Crista and I put together using the school data, my particles per breath calculation, and her eye for visual display are below. The dots show how many particles per breath and the imagery is from the students at the school to remind everyone why we should care about this stuff.
 So I applied our Keeping Watch on Air methods/thinking to the air quality data from today. Here’s what I found.
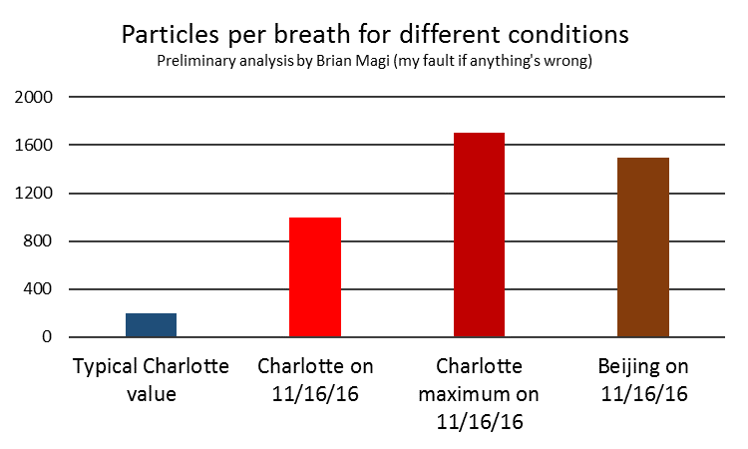
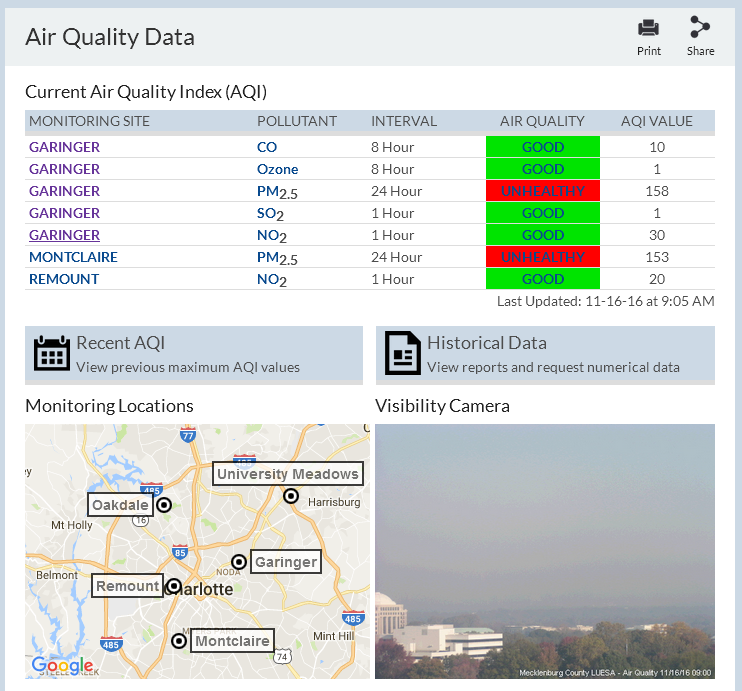 This morning, Charlotte/Mecklenburg was in Code Red air quality, which is an unusually high value of AQI that we have not experienced in the last five years at least (thankfully!). Our AQI was 158 this morning from Garinger High School, which is managed by our county air quality office so they can report official numbers to the Environmental Protection Agency (EPA) and they can check our county against the national standards for pollution that have been established by science. The 158 AQI is determined from the average PM2.5 over the past 24 hours. Within that 24 hour period, there was a morning peak of AQI of 188 when I looked at the NC Division of Air Quality data. When I convert the 158 AQI to particles per breath via the methods I used for Keeping Watch on Air, then I found that we were breathing about 1000 particles per breath over the past 24 hours. The background “typical” PM2.5 concentration in Mecklenburg is much lower – around 100-200 particles per breath. So the air we were breathing today had about 10 times as many particles in every breath we took! And it was even higher – around 1700 particles per breath – during the peak of the pollution.
For comparison, I tweeted about how our air quality compared with the super-polluted megacity of Beijing, which is home to more than 10 million people. Our State Department USA embassy in Beijing has a high-quality air monitor system there and sends out automated tweets https://twitter.com/BeijingAir which is what i looked at to build a comparison. Their 24 hour avereage PM2.5 from about the same day as Queen City’s air pollution showed PM2.5 AQI of 180, which I translated into about 1500 particles per breath. Essentially, for this kind of quick “back of the envelope” type of calculation, our air quality and Beijing’s air quality were about the same. Said another way, if you felt discomfort or worse in today’s air quality, imagine living in Beijing or another mega-city without the policies that regulate pollution for us to actually have clean air.
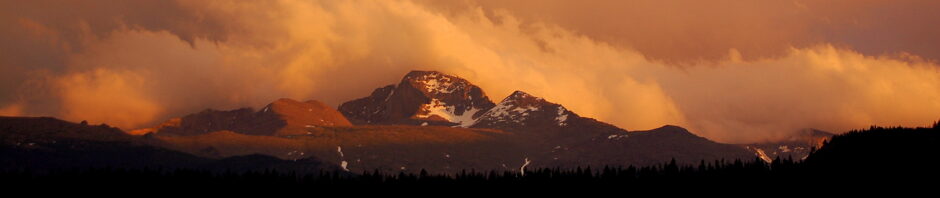
 Bottom line, for much of the day we were breathing more than 10 times as many particles in every breath than usual. This is like a semi-typical day in Beijing where 50% of the days have AQI greater than 169 according to this peer-reviewed analysis by atmospheric chemists. I am working with staff at Clean Air Carolina and at least one UNC Charlotte student (Calvin Cupini) on analyzing data we collected around this pollution event, but results are TBD. It’s rare to have super high air pollution here, so as scientists we try to learn about what this means. As a fellow citizen of Mecklenburg, I do worry about what even a few days of high pollution means for all of our neighbors, and especially kids. For now, try to enjoy more colorful sunsets while the Queen City is impacted by all the smoky gunk in the atmosphere, and breathe deep when this pollution event subsides.