carbon

Climate change and 400 ppm carbon dioxide

In the great carbon cycle that is at work on our planet, carbon dioxide (CO2) gas concentration in our atmosphere, as measured in the most famous observation site in the world (Mauna Loa, Hawaii, home of the Keeling Curve), has risen again above 400 parts per million, or 400 ppm for short. mlo_two_years-2015-01-12This happened in 2014 before CO2 dipped back below 400 ppm, and while 400 ppm is an arbitrary choice to focus on, round numbers typically get more attention than, say, 397 ppm. Think about a baseball player’s batting average, which is hits divided by at bats. Somehow a 0.299 (or “299”) batting average is perceived as worse than a 0.300 (300) batting average, but really, it’s the difference of a few hits (or at bats) in the course of a season. Ted Williams hit 406 in 1941. 185 hits in 456 at bats. 3 fewer hits, and he would have hit 399, and the world would’ve sighed. 3 hits! Back to CO2. I’ll suggest, like many others, that 400 ppm is a good place to step back and think.

What is the carbon cycle?

IPCC AR5 Figure 6.1 is a nearly perfect capture (as it should be given the expertise that developed the figure!), but I boiled away the beauty to a more practical figure for my classes. carbon-cycle-boiled The reason that CO2 goes up and down in any given year is mainly because the Earth breathes in and out. When the Earth breathes in, plants draw CO2 from the air and convert it to plant carbon via photosynthesis. As a result CO2 concentration in the atmosphere goes down. When the Earth breathes out, plants release CO2 into the air via that respiration, the process of decomposition that acts in the opposite direction of photosynthesis. CO2 concentration in the atmosphere then goes up. The breath results in a steady rise in CO2 concentration from October to May, and a steady decrease from June to September. As you would expect, the rise and fall are essentially reversed in when they occur in the Southern Hemisphere, and this is evident in the data as well. As you might also surmise, in the Northern Hemisphere, the enormous number of seasonal plant growth/decay results in a bigger “breath” than in the Southern Hemisphere. Check the graph here to see that hemisphere difference.
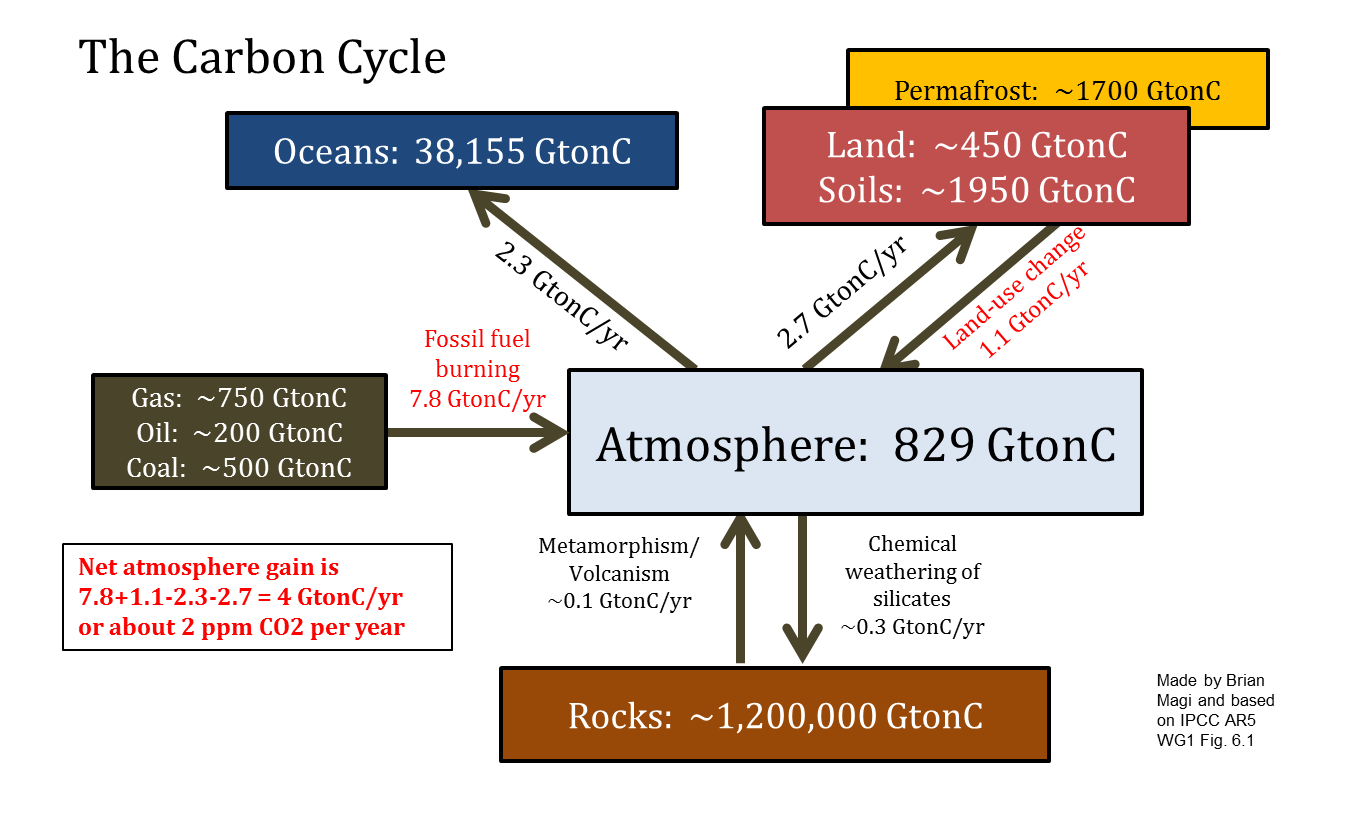
The Keeling Curve, and CO2 concentration in general, is a way to “see” a part of the Earth’s carbon cycle, which are all the physical/chemical/biological/geological (biogeochemical, for short) processes that exchange carbon. The exchanges between carbon “reservoirs” (for example, the atmosphere and the land in the figure above) happen at different rates and magnitudes. Oceans store enormous amounts of carbon from CO2, and rocks store even more. The atmosphere is relatively carbon-free, but we are burning carbon from rock reservoirs (fossil fuels), and burning is a combustion chemical reaction that produces many carbon-containing gases and particles, but most fundamentally water vapor and CO2. This CO2 goes into the atmosphere and stays there for a long time. Water vapor goes into the atmosphere too, but leaves the atmosphere within a couple of weeks via precipitation. As a result, the year to year variability shows the Earth’s breath (land-atmosphere exchange), but the long-term trend shows that CO2 concentration itself is increasing when you compare the average from one year to one from a previous year. That long-term trend is showing how more and more carbon from CO2 is being stored in the atmosphere reservoir of the carbon cycle.

We are FORCING the carbon cycle to change by changing the amount of carbon in the atmosphere. That 400 ppm concentration value is a measure of how much carbon from CO2 (in units of mass, like kilograms or pounds) is in the atmosphere. The change in concentration is a measure of how much carbon from CO2 has been put into the atmosphere (again, in units of mass). The pre-industrial concentration of CO2 was about 280 ppm, so 120 ppm has been added to the atmosphere reservoir in the carbon cycle. It’s relatively easy to show that +120 ppm is equal to 284 billion tons of carbon added to our atmosphere.

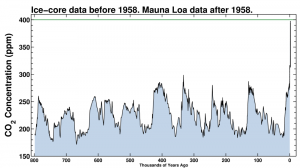
Most of that 120 ppm is from human activities of fossil fuel burning (moving carbon from rock reservoir) and from deforestation (moving carbon from land reservoir), and 400 ppm is, as far as humans are concerned, completely unprecedented. ipcc-ar5-wg1-Fig6-08 At no time in the past 800,000 years, through several ice ages and enormous climate changes (figure at bottom), has the planet had concentrations of anything close to 400 ppm. Furthermore, it is quite clear from scientific and anthropologic evidence (at least!) that human civilization has evolved in a period of relative stability in Earth’s climate history. CO2 concentration has largely remained around 280 ppm until the last 100 years or so. Evidence that scientists have collected suggest that CO2 and temperature track each other. This is fundamentally why most climate scientists, and most scientists in general, are concerned about short and long term futures.
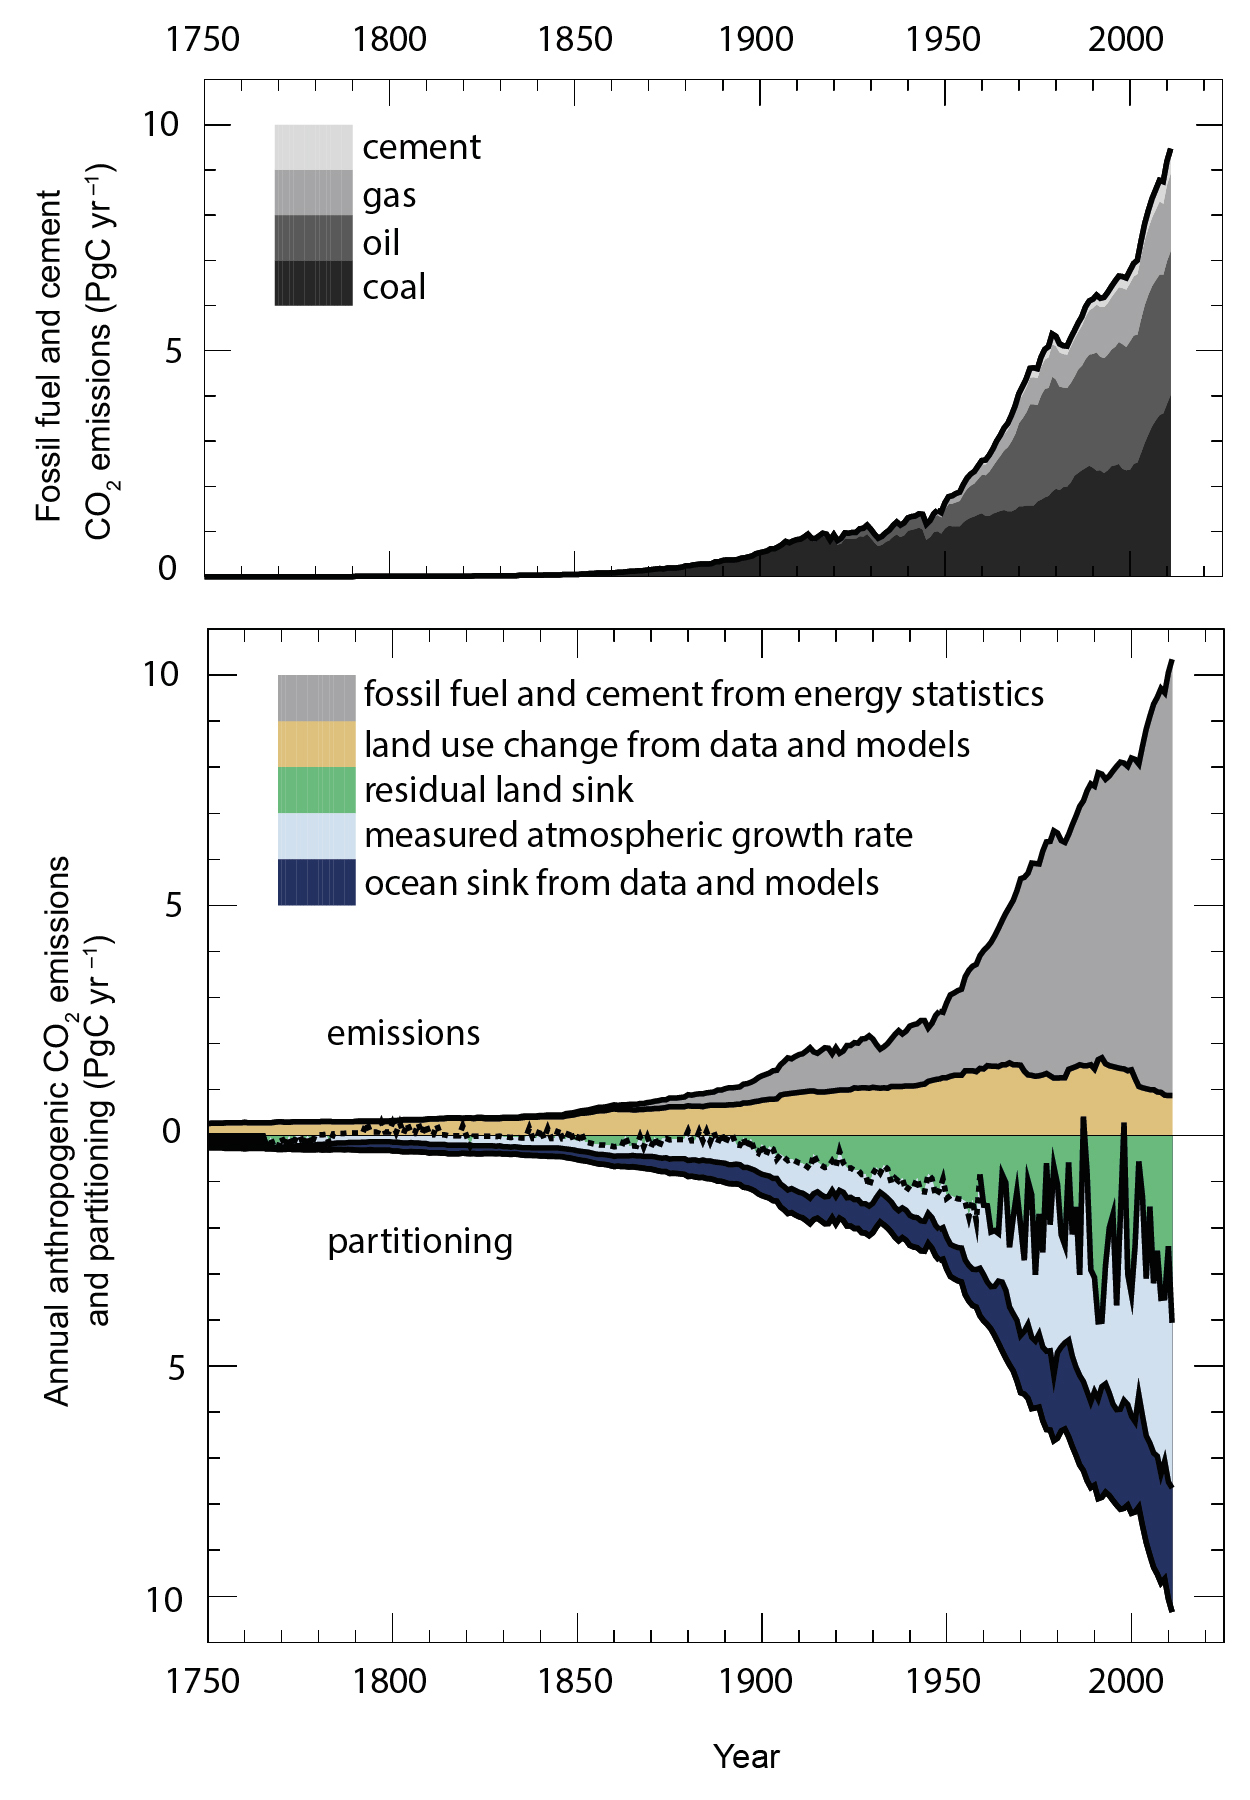
Humans can adapt and we will have to adapt to some degree, but the changes we are imposing on the planet through the carbon cycle are much faster than anything that we have an analog for in the past through naturally-driven climate changes. This is where carbon mitigation strategies are so critical, and why everyone is talking about the EPA Clean Power Plan, COP20 Lima, China-USA negotiations, and the upcoming COP21 Paris negotiations. These negotiations are about whether humans can live on the world without altering it in ways that more than likely is detrimental before being beneficial. Right now, the science says we are not very good tenants. With 400 ppm CO2, we are breathing air with more CO2 in it than any other human or proto-human has ever breathed. It’s not poisoning us directly, but the increased CO2 is changing how the Sun and Earth-Atmosphere system are interacting with each other. We are forcing the planet to warm as more electromagnetic radiation is absorbed by the unusual excess of greenhouse gases in the atmosphere. The warmth is changing everything, and it will continue.
co2-800k-present

Voting for action on global environmental change

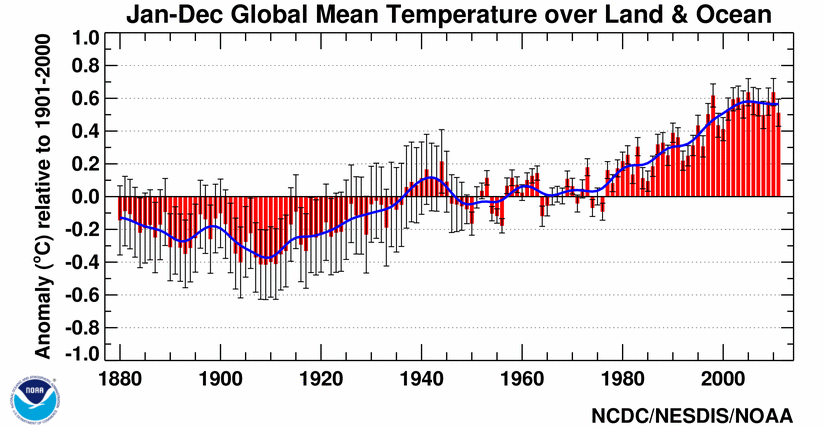
global-201101-201112As real as global warming (figure above from NOAA NCDC) is, and as much as we expect that the science has done enough, one US lawmaker recently said
I am for global action on climate change. I am a proud supporter and very anxious for the U.S. to participate globally. But I think if you look at the current makeup of the U.S. Senate, it’s very difficult.

This is a quote from Senator Ben Cardin (D-Md.) that I drew from a recent article that I’ll get to below. As I close off discussions with 28 undergraduate students of Earth Sciences, Geology, Meteorology, and Economics this semester in my Global Environmental Change course, the questions that permeate their responses to readings* we went over in class are

1. WHAT CAN WE DO?
2. WHY AREN’T WE DOING ANYTHING?

I bring a lot of current discussion into the classroom – more than the previous iteration of my course and I await my course reviews and student comments to better understand which materials resonated and which did not. In the meantime, my answer to the driving questions for the future of our state and country is simple: VOTE. Vote for the legislators that work on issues that you think benefit the global community.

The simplicity in my answer is partly because I don’t have a better answer, but partly because this is where the science stands. Namely, science has arrived at robust conclusions based on decades of intense research by communities of experts, most recently evidenced by the full report of the IPCC. Earth scientists keep working on issues because we are interested in what makes the physical world tick, and just like any community of professionals, the majority of us work on science that is relevant. The most relevant Earth science is climate science. I think it is safe to say that most Earth scientists want to see some actual climate action rather than the empty words that most that most of the action statements by politicians have amounted to so far. A widely-cited scientific paper about a way to visualize and break down carbon mitigation strategies into manageable parts said that the choice is simple: Act or delay.

If we want action, we cannot rely solely on science and engineering – we need policy makers. Policy makers are elected by people. So if my students want to help, vote. If citizens in general want to help, then vote. An interesting report by Lisa Friedman at Energy and Environment News included quotes from US lawmakers about the upcoming 2015 Paris climate meeting that many were hoping would be much farther along after this year’s Poland climate meeting. I’ll include several below:

It will be difficult to get a treaty passed in 2015 in the U.S. Senate as it is presently constituted

———————————–> Sen. Ed Markey (D-Mass.)

Keep our eyes on the prize of creating an ambitious, effective and durable agreement. Insisting that only one way can work, such as an agreement that is internationally binding in all respects, could put that prize out of reach.

———————————–> U.S. Special Envoy for Climate Change Todd Stern

[A binding agreement is] not going to go anywhere. It’s dead on arrival… [EPA limits on CO2 emissions from future power plants are] hurting our economy on a daily basis.

———————————–> Sen. John Barrasso (R-Wyo.)

There is a lot of difference of opinion among very educated people on the science [of global warming]. [On whether a binding agreement would pass the Senate: ] I kind of doubt it. There is still a legitimate question of science, and you can’t brush that away.

———————————–> Sen. Orrin Hatch (R-Utah)

I think this [a global climate treaty] is an issue that can flip very quickly. [An EPA regulation, for example, would] put a lot of costs on polluters and cause them to rethink the wisdom of an economywide carbon fee. If we can organize the armies on our side, it’s a rout. We just haven’t bothered to organize them. [The fact that climate is back in the political discussion and may be in 2014 means] that adds up to 2015 being a pretty good year.

———————————–> Sen. Sheldon Whitehouse (D-R.I.)

This problem is global, not just related to any one country or only one region. We need an international effort, and I think there’s growing support for that in the United States.

———————————–> Rep. Henry Waxman (D-Calif.)

We need to set a good example to the rest of the world. That way, when we call on China and India and other big emitters, we can say not only ‘Do as I say,’ but ‘Do as I do.’

———————————–> Sen. Tom Carper (D-Del.)

Increasingly, the U.S. is being viewed as a leader. Especially if the administration takes action on coal-fired power plants, I think it will be very hard, then, for China and India to say the U.S. is not acting.

———————————–> Sen. Ed Markey (D-Mass.)

[Action might require] some kind of catastrophe… I think [global warming and subsequent impacts are] real, and I think that we should continue to explore our options to reduce the effects of it. [He has not liked] anything I’ve seen lately [about how the UN climate process has influenced US lawmakers.] [Still, he conceded,] I don’t think talking hurts. It probably helps.

———————————–> Sen. John McCain (R-Ariz.)

Are pathways opening up? Has Obama been able to set up his position strongly enough to promote policies that are in line with the science? Well, it comes back to the simple solution: Vote for what you believe. I would argue that your political party – socially or economically – is not the relevant part of a vote that supports climate change policy.

As Professor Andrew Dessler argues in his book, and as many other climate and climate policy scientists argue, the decision to move away from energy sources with high carbon emissions is completely reversible – if the climate science summarized in the IPCC reports is entirely wrong or even partly wrong about carbon cycle science,

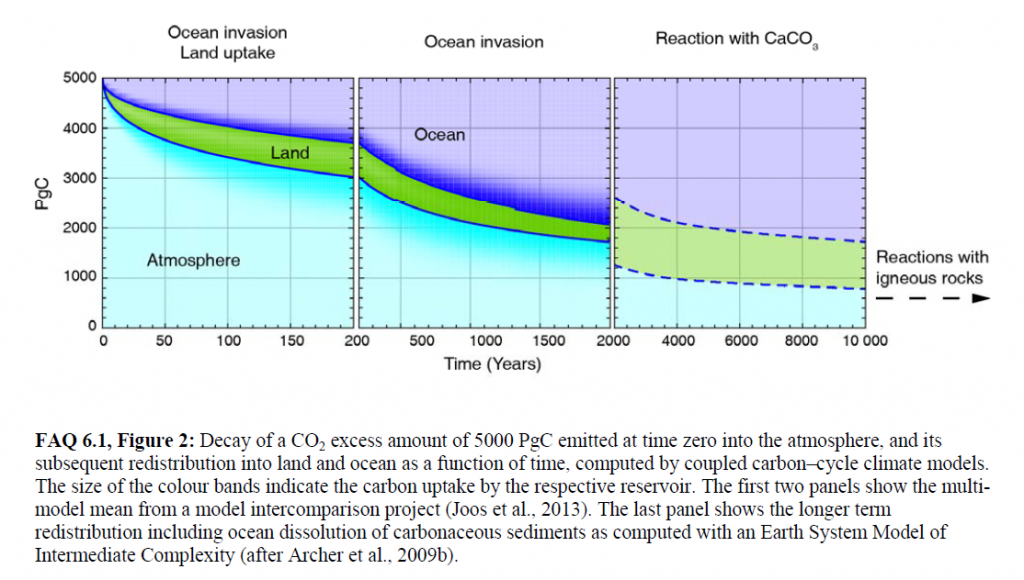
Figure 2 from Chapter 6 (Carbon and Other Biogeochemical Cycles) FAQ 6.1 of IPCC AR5 Working Group 1.  Shows that some fraction of a 5000 GtC pulse of carbon emissions - on scale with a pulse from burning all fossil fuel reserves - would affect the atmosphere for 1,000s to 100,000s of years.  Roughly 40% of the pulse would remain in the atmosphere even after 2000 years.

Figure 2 from Chapter 6 (Carbon and Other Biogeochemical Cycles) FAQ 6.1 of IPCC AR5 Working Group 1. Shows that some fraction of a 5000 GtC pulse of carbon emissions – on scale with a pulse from burning all fossil fuel reserves – would affect the atmosphere for 1,000s to 100,000s of years. Roughly 40% of the pulse would remain in the atmosphere even after 2000 years.

we can always go back to burning the least expensive energy sources without regard to the environment. But if climate science is even close to right, then we are facing irreversible changes (see the figure above) to the carbon cycle that will affect the Earth for centuries, millenia, and even further.

As I told my students, the questions that we face are civilization scale (echoing Rep. Waxman’s quote above). Human civilization emerged as a presence on Earth somewhere between 20,000 and 200,000 years ago. I’m no archaeologist, so that number isn’t particularly important. The point is that dinosaurs managed to survive for 165 million years on Earth and evolve into the Cretaceous Period species that we know and love (tyrannosaurus rex, triceratops, etc.). It sure would be nice to think that our advanced technology means we can learn to live in harmony with the planet longer than the dinosaurs! Considering that the dinosaurs were finally offed by a meteorite, I’d say we have a lot to prove still.

*readings from Elizabeth Kolbert, Andrew Dessler, IPCC AR4 and AR5, news posts from New York Times and Washington Post, and multimedia presentations such as Thin Ice, Earth The Operators Manual, and data visualizations and tools focusing on climate-relevant data like carbon emissions, temperature records, and climate model projections

Charlotte Citizens Hearing on EPA Proposal to Regulate Carbon Emissions

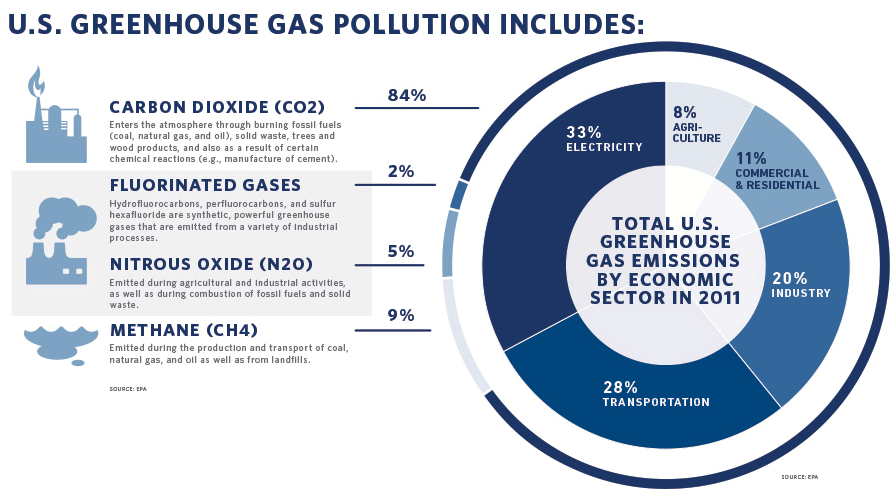
Real conversations about how we can act on climate change (#ActOnClimate) seem to be happening right now. Environment North Carolina published their tabulated emissions from state power plants, and even highlighted North Carolina’s role in this.ghg-largeTo offer public support for the EPA proposal to limit carbon emissions from any new power plant, Clean Air Carolina and NC Conservation Network are hosting a Citizens’ Hearing in downtown Charlotte on Tuesday October 15 from 6-7:30pm (more info below). Charlotte Observer noted the event, and the general public is invited to participate. I will attend and offer brief remarks about the climate science behind the EPA proposal. Please join us and support the proposal to FINALLY regulate some of the emissions from any new power plants. This discussion will set the stage for the presumably upcoming/inevitable proposal to regulate emissions from existing power plants the EPA should have ready next year. From the Clean Air Carolina post:

Last week, the Environmental Protection Agency (EPA) announced its first steps under President Obama’s Climate Action Plan to reduce carbon pollution from power plants. The EPA will soon hold hearings in various cities at which the public can comment.

For decades, public participation has become a regular and important part of how new laws are carried out. As an alternative to attending an official EPA hearing, communities across the country will hold “Citizens’ Hearings” and all comments will be recorded and sent to the agency as official public record. Clean Air Carolina and NC Conservation Network are hosting the Charlotte Citizens’ Hearing on Tuesday, October 15 to allow area residents the opportunity to provide oral testimony on the new rule.

Charlotte Citizens’ Hearing
October 15, 2013 – 6:00 p.m. – 7:30 p.m.
Caldwell Presbyterian Memorial Church
1609 East 5th Street
Charlotte, NC 28204
RSVP today and let us know you’re coming!

Cleaning up power plant pollution will result in better air quality, healthier communities and a major reduction in climate changing pollution. Just today, the world’s top climate experts have announced an upper limit on carbon emissions that they warn we cannot pass if we are to avoid the most dangerous effects of a warming planet. Join us for the Charlotte Citizens’ Hearing to show your support for strong carbon rules on new and existing power plants! See below for Citizens’ Hearings scheduled in other NC cities.

Tracking and targetting emissions from power plants

Speaking as a part of a press release about power plant carbon emissions in NC.

Speaking as a part of a press release about power plant carbon emissions in NC.

As my students probably know by now, I think an important point when discussing or even thinking about how to deal with the combination of our hunger for energy and global warming is to remember the scales of the problem. There are two important scales to consider in every discussion of global warming: time and space. The adjectival forms would be “temporal” and “spatial”. The super-cool adjective, which I probably overuse, is “spatiotemporal”. Spatiotemporal analysis is critical to understanding global warming and what it means in any single location on Earth. The temporal scale is highlighted over and over again right now because of the global warming “pause”, which as any analysis or background research should reveal, is nothing more than a pause and that plenty of research is underway and done that helps to understand yet another small surprise in the complex Earth system. One part of the problem of climate change that is not surprising is what is the cause. Carbon emissions from fossil fuel burning are the main culprit, so the prescription is simple: Stop burning fossil fuels. Hah! This comes back to our hunger for the energy stored deep in the Earth, so the answer is definitely not as simple as the prescription.

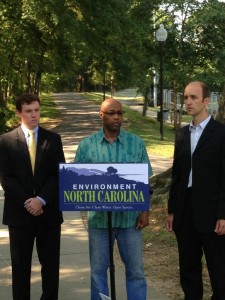
Me talking about the state of climate science with Graham Givens of Environment NC, Ronald Ross, local resident and Vice President of Stewart Creek Environmental Association, and reporters!

Me talking about the state of climate science with Graham Givens of Environment NC, Ronald Ross, local resident and Vice President of Stewart Creek Environmental Association, and reporters!

I provided some scientific feedback to an effort by Environment North Carolina a few weeks ago that I neglected to highlight on my research webpage (but I did on twitter), and I will expand on this a little now. Environment NC released a report of carbon emissions from power plants across the USA. Power plants (coal, natural gas) are required to track and report these emissions, so sometimes groups just need to put forth the effort in assembling these numbers into a coherent piece of writing, which is what Environment NC did. They found that 3 of the top 50 most serious carbon emitters were in the state of NC – they are all coal plants of course. Coal is still being burned even though Natural Gas is used more and more. The key findings, as Environment NC stated on their written press release, are:

  • The Marshall plant, near Lake Norman, emitted 10.1 million metric tons of pollution in 2011, the equivalent of 2.09 million cars.
  • Three of the most polluting power plants in the country are in North Carolina: Belews, Roxboro, and Marshall.
  • Belews Creek Power plant near Winston-Salem was the state’s biggest global warming polluter and 16th overall, emitting 13.8 million metric tons of carbon pollution, the equivalent of 2.9 million cars.
  • North Carolina’s power plants are the 12th most polluting in the country, producing as much carbon each year as 15 million cars.
  • North Carolina’s power plants are its single largest source of carbon pollution – responsible for 51% of the carbon pollution in the state.
  • The press release was at their news site, and they arranged a live release for media. I went to Frazier Park near the heart of the Queen City early in Septemeber to speak about the science, essentially relying on the discussion in IPCC AR4, which is what I discuss in my classes too. I spoke from the position of scientific evidence. The press release at Frazier Park made its way through state and city news outlets, and I thought the reporters did a great job with the write-ups. Here are some links:

    Charlotte Business Journal

    WSOC-TV in Charlotte

    NC Public News Service

    Charlotte Observer

    I think on the eve of the release of the first part of the IPCC Fifth Assessment Report, it’s important to remember that the solution to the problem of global warming, or at least the best way to mitigate the problems, begins at a local level. We have to remember that the carbon emissions in our backyard – which Environment NC highlighted – affect the entire world. CO2 lasts 100-1000 years in the atmosphere so CO2 from North Carolina will be absorbing infrared radiation for a long, long time. Maybe I’ll write an op-ed for the Observer.

    Global carbon emissions increased in 2012

    Unlike the somewhat misleadingly rosy picture painted by President Obama about (USA) carbon emissions in his Inaugural Address and his State of the Union speech in 2013, the global carbon emissions are what matter. So if the USA continues to mine coal and ship it elsewhere, it is not an improvement except for the USA emissions portfolio. It’s like a gambler who doesn’t count losses at casinos other than the one he or she is sitting at. The International Energy Agency released a report stating that global carbon emissions are up 1.4%.bluemarble.eastI haven’t read the IEA report, but I came across the press release via the excellent energy/economy reporting they are doing. Then I heard the same WA Post reporter on the Diane Rehm show this morning (available for mp3 download via ITunes, for example). Then I read about the IEA article on Climate Central. Whew!
    The Diane Rehm show had a good panel, with a requisite global warming “skeptic” (whatever that means!). That skeptic role was played by an analyst from The Heritage Foundation*. The other roles on the panel were the Post journalist, an analyst at the Environmental Defense Fund**, and a research scientist from Rutger’s University***. I would say that Diane Rehm handled the panel well, and I think that the Heritage Foundation representative overplayed his hand to the point where his comments were generally made irrelevant. In other words, he spoke too much and too glibly (is that a word) and made points that undermined his real argument that adaptation may be the most likely pathway (which is actually kind of interesting). The other panelist laid into the sillier points that the skeptic made and shut him down. Rehm left it that way.

    Shutting down those punchline-style quips (memes) is really how the discussion should be every time. The Earth is warming. CO2 and other greenhouse gas concentrations continues to rise. The conversation should be about how it is our civilization needs to adapt and change. This is what the IEA discusses. Mitigation of carbon emissions is a huge discussion in the science journals. The IEA report is highlighting that we as a civilization are heading towards a major point in our hunger for fossil fuel based energy. This hunger has been targetted by scientist since the 1980s and arguably since the late 1800s! Think about solutions and strategies when you are thinking of how you want to make an impact on your community or your country or even the world. Think about our Earth and our future. The world needs you.

    *The Heritage Foundation webpage states: Founded in 1973, The Heritage Foundation is a research and educational institution—a think tank—whose mission is to formulate and promote conservative public policies based on the principles of free enterprise, limited government, individual freedom, traditional American values, and a strong national defense.

    **The Environmental Defense Fund webpage states: We are passionate, pragmatic environmental advocates who believe in prosperity and stewardship. Grounded in science, we forge partnerships and harness the power of market incentives.

    ***Dr. Jennifer Francis is deeply involved in improving our understanding of how the Arctic affects the USA – see google scholar or video of her talking about her work

    CO2 time line for May 2013

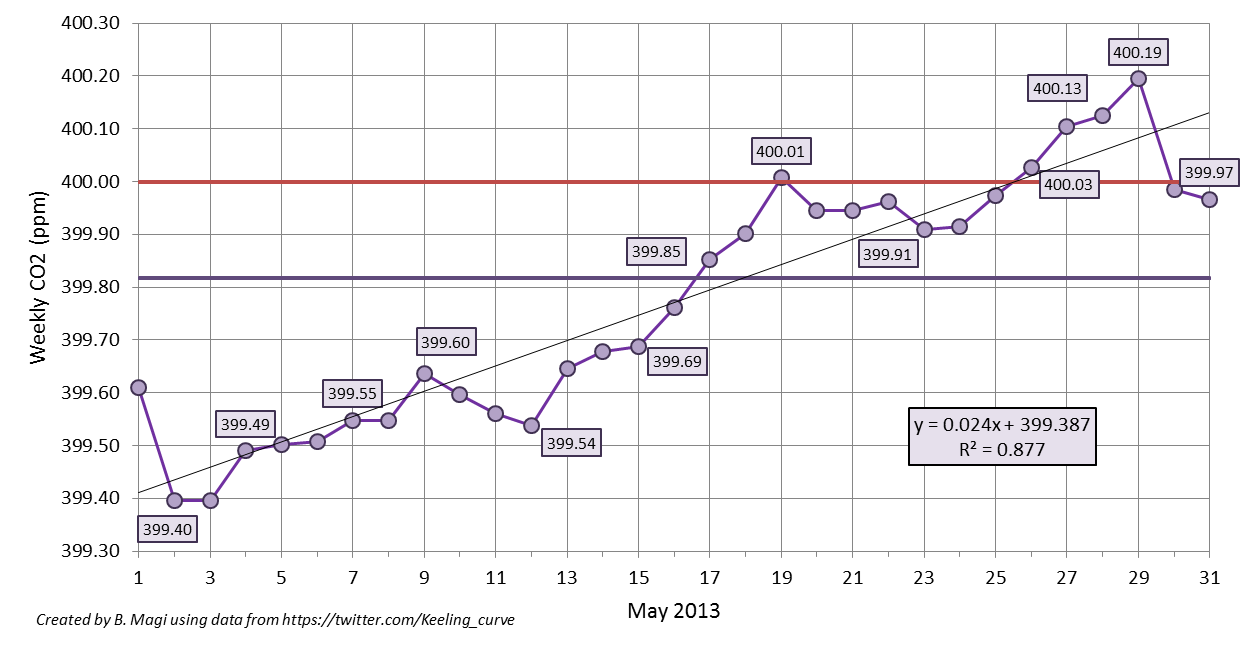
    The month of May is officially over, and perhaps the Earth is about to take a big breath in and begin to draw down CO2 from its year 2013 peak. The last tweets by @Keeling_curve showed a relatively (emphasis on relatively!) sharp decrease from May 29 to May 30 with CO2 falling from 400.33 ppm to 398.41 ppm, and then May 31 had variability that was too high as tweeted here. Funny side note was that for whatever reason, this “data too variable” drew the attention of one well-known (but not well-respected) blog, to which @Keeling_curve replied “see here“. Geez, you’d think seasoned bloggers would click a couple of web links before tweeting a question like that. The values of CO2 should start their annual decrease from the peak value in the Northern Hemisphere as the plant life in temperate and polar zones comes to life, but in the mean time, we’re living in the age of a 400 ppm CO2 world, which is very unusual in recent geological history, as discussed here and shown here. Here’s the time line of CO2 concentrations for this historic May 2013co2-2013-05which shows the weekly-averaged CO2 from the daily-averaged values posted on Twitter (ok, tweeted). The straight horizontal purple line is the monthly-averaged CO2 of 399.82 ppm (wow!), and the straight red line is the mystical 400 ppm CO2. I calculated the weekly-average as the value of the previous 7 days up. For example, May 15 weekly-average is the average of values from May 9 through May 15. The weekly-average ideally is 7 data points, but occasionally a daily-averaged value is not tweeted due to high variability in the data. From the figure you can see that we reached our first weekly-averaged CO2 concentration greater than 400 ppm on May 19. I actually thought that would be it for the year, but from May 24 to May 29, daily values were again well over 400 ppm. This brought the number of weekly-averaged values greater than 400 ppm up to 5. Roughly, about 33% of the days in May 2013 had CO2 greater than 400 ppm. The decline should begin soon with the annual minimum in September-October reaching values of about 394-395 ppm, noting that the annual minimum for 2013 will probably be very close to the maximum from only 2 years ago. Below is the data shown in the graph above. An impressive May, and one that will be recorded in the history books.
                           carbon dioxide (ppm)
    year    month   day     daily   weekly
    2013	5	1	*	399.61
    2013	5	2	399.29	399.40
    2013	5	3	*	399.40
    2013	5	4	399.68	399.49
    2013	5	5	399.54	399.50
    2013	5	6	399.52	399.51
    2013	5	7	399.71	399.55
    2013	5	8	*	399.55
    2013	5	9	399.73	399.64
    2013	5	10	399.4	399.60
    2013	5	11	399.46	399.56
    2013	5	12	399.41	399.54
    2013	5	13	400.16	399.65
    2013	5	14	399.91	399.68
    2013	5	15	399.74	399.69
    2013	5	16	400.25	399.76
    2013	5	17	400.04	399.85
    2013	5	18	399.8	399.90
    2013	5	19	400.15	400.01
    2013	5	20	399.73	399.95
    2013	5	21	399.91	399.95
    2013	5	22	399.85	399.96
    2013	5	23	399.88	399.91
    2013	5	24	400.09	399.92
    2013	5	25	400.2	399.97
    2013	5	26	400.53	400.03
    2013	5	27	400.27	400.10
    2013	5	28	400.06	400.13
    2013	5	29	400.33	400.19
    2013	5	30	398.41	399.98
    2013	5	31	*	399.97
    

    *data was too variable over the course of the day. no value was reported on twitter.

    CO2 in the very merry month of May

    The whole month has been an edge-of-your-seat wait-and-see when CO2 will stop hovering above and below 400 ppm and just stay above. Unlike Miguel Cabrera‘s triple crown of 2012 or the thoughts that he could repeat that feat in 2013 or even be the first since Ted Williams to hold a 400 batting average (can he do it – this evidence says yes), the increase in CO2 above 400 ppm is inevitable. Inevitability means you just need patience. Patience for me means more time to think about the numbers.

    CO2 data are available from a number of sites

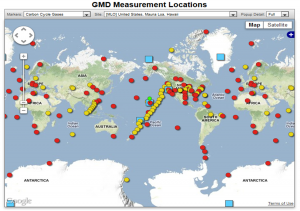
    Sites around the world that are monitoring CO2 and other gases in the atmosphere.

    Sites around the world that are monitoring CO2 and other gases in the atmosphere.

    and there are differences in hemispheric CO2 concentrations that are completely expected due to emissions source location and atmospheric transport times, as discussed earlier. The Mauna Loa CO2 measurements are the ones I’ve been watching with more interest than this year’s baseball season and the daily-averaged CO2 concentrations are reported on the web and via twitter, among other places. Twitter is turning out some good and interesting data like this.

    According to the twitter feed, daily-averaged CO2 exceeded 400 ppm on May 13 with CO2 of 400.16 ppm. By my own calculations using the daily tweets, weekly-averaged CO2 exceeded 400 ppm for the first time in the week ending May 19 (CO2 was 400.01 ppm). The next milestone is when the monthly-averaged CO2 exceeds 400 ppm, and then annually-averaged, and so on. We are approaching what should be the peak CO2 this calendar year as the growing season begins and CO2 is drawn down from plants breathing in CO2. Eventually, the Earth will be perpetually impacted by more than 400 ppm CO2 and even the seasonal drawdown in CO2 of 5-6 ppm from May to October every single year as plants in the biosphere convert CO2 into oxygen via photosynthesis will not overcome the long-term trend in CO2. The CO2 will remain in our atmosphere for 100s-1000s of years. The Earth will slowly re-equilibriate to this elevated CO2 through a myriad of processes that include ocean uptake, plant growth, chemical weathering, and finally increased surface and lower atmospheric (tropospheric) temperatures due to the absorptive power of CO2 in the infrared part of the electromagnetic spectrum. The impacts of increased CO2 and other atmospheric components that can force climate into a new state are the main reason climate science remains active. In a post that will be ready as soon as the data is available (June 2), I’ll show the weekly-averaged CO2 trend in the month of May based on the Keeling Curve twitter feed. In other words, I’ll show inevitability.

    CO2 and climate sensitivity

    On Thursday, May 16, 2013, the official daily-averaged CO2 concentration in the atmosphere was reported by Scripps as (drumroll please)co2-2013-05-16Like I pointed out, 400 ppm is inevitable because CO2 increases by 2 ppm every year, but to actually see a value like that reported makes it more real. Now we await a value that is over 400 ppm for an entire week, and then for a month, and then it’s just a matter of time when we are in a world with 400 ppm of CO2, remembering how different this is than any time in Earth’s recent history as shown in the figure to the right (click to make larger).co2_800kRemember that CO2 in the atmosphere is a pretty simple physical perturbation on the Earth’s energy budget – more CO2 will result in an atmosphere that absorbs more of the infrared energy that the Earth emits to space to try and cool off. The energy that does not escape and is absorbed is then re-emitted towards the surface (and towards space). This forces the Earth to warm in response to try to bring the energy budget back into balance since balance is inevitably what everything in the universe seeks to achieve. This forcing of the Earth’s temperature has never been in doubt. The real question is how the Earth SYSTEM will respond to the extra energy or extra warmth. The SYSTEM is something I will start talking about here and it is certainly the most complicated aspect of climate science. Imagine the complexities associated with trying to understand how the atmosphere, ocean, land and plants, ice, and even humans and animals will all respond and how each affects the other! That is the heart of Earth system science and the heart of the very current discussion about climate sensitivity – a measure of how the system in total will respond to perturbations like more CO2 in the atmosphere. A very nice op-ed in the New York Times by Justin Gillis this week highlights the frank evaluation and debate about climate sensitivity occurring in the scientific community that has arisen from the apparent slowdown in the increase in globally averaged temperature (since about 2002 in the GISS time series or slightly more evident in the NCDC time series below)global-201101-201112The issue is getting a load of attention and, as Gillis wisely acknowledges, the analysis and studies in the peer-reviewed scientific literature will take a couple of years to “settle” on an answer. I agree. The public and policy makers and just about everyone wants to know the answer though so every publication or even statement about climate sensitivity will be intensely amplified. I’ve been reading about this issue myself, mostly as I prepare to bring the very current discussion into the classroom (here, here), but also because I am as concerned about the Earth as anyone. Here’s a final statement by Gillis that I also agree with.

    Even if climate sensitivity turns out to be on the low end of the range, total emissions may wind up being so excessive as to drive the earth toward dangerous temperature increases. So if the recent science stands up to critical examination, it could indeed turn into a ray of hope — but only if it is then followed by a broad new push to get the combustion of fossil fuels under control.

    Regardless of the climate sensitivity, changes to our lifestyles are inevitable. Will our society and will the USA be seen as forward-thinking or will we revert to the simplest and most destructive way to get energy?

    Another week of CO2 from Scripps

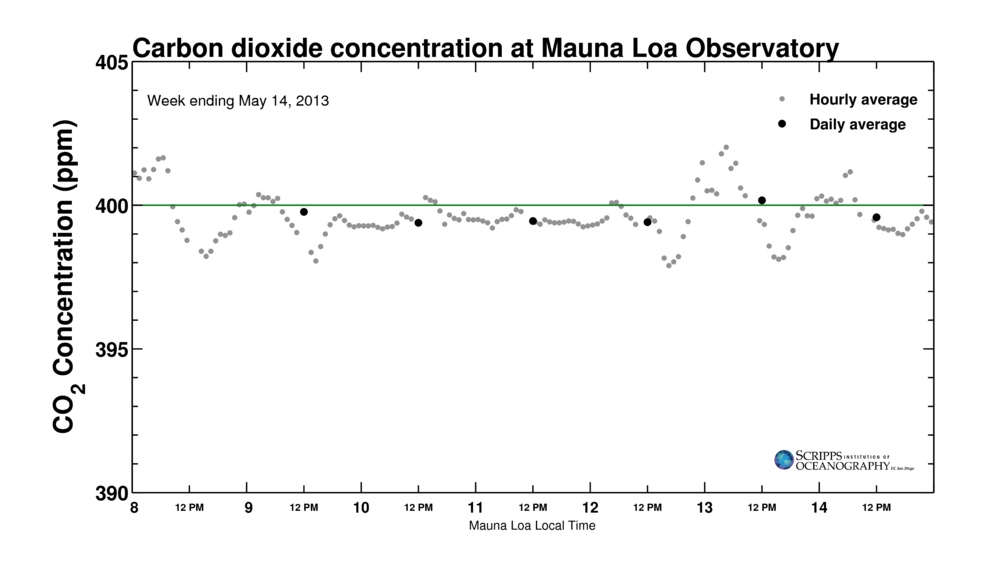
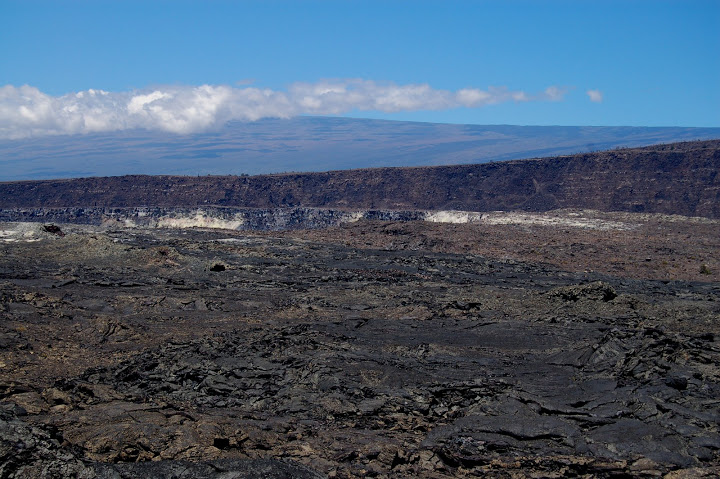
    An update to my update from the original post. CO2 is rising 2 ppm/year and has been for about the last decade (see graph here). So the daily ups and downs and pretty miniscule. 2 ppm/year is 0.0055 ppm/day, or thought of yet another way – it’ll take about 180 days for CO2 to increase 1 ppm. While we await the inevitable, here’s an update with May 13 at least above 400 ppm, although the measurements are pretty variable for some reason.mlo_one_week-2013-05-14Variability in CO2 during the course of any one day can be for a number of reasons. One that scientists responsible for quality-control of the data have to account for is the simple fact that Mauna Loa is a gigantic shield volcano

    Photo taken by me from the Kilauea Caldera in 2007.  Mauna Loa (13000 ft elevation) looms in the background under a shroud of clouds, but it's shocking how small that 13000 ft mountain looks.

    Photo taken by me from the Kilauea Caldera in 2007. Mauna Loa (13000 ft elevation) looms in the background under a shroud of clouds, but it’s shocking how small that 13000 ft mountain looks.

    Well, scientists are nothing if not rigorous and attentive, so here’s a nice post by a NOAA scientist talking about the volcanic CO2 pulses that occasionally disrupt the background CO2 measurements that Mauna Loa is best known for. I haven’t read the papers about the volcano relevant emissions, but the link at the bottom of the page gives the information needed to track down the publications via google scholar. That being said, it doesn’t look like the variability in the hourly values for May 13 CO2 was due to volcanic emissions.

    CO2 hovering above and below 400 ppm

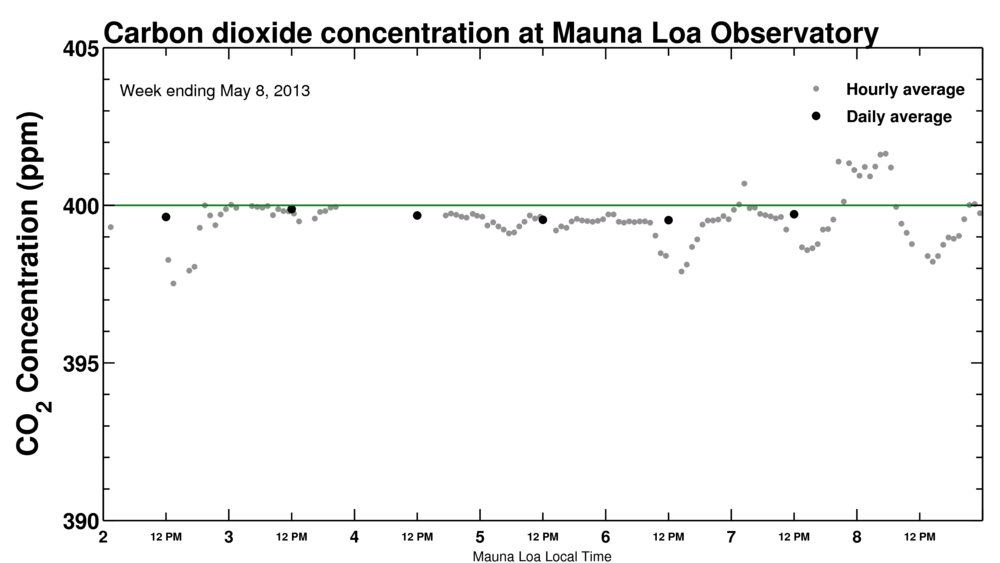
    An update from the measurements being reported from Scripps that I discussed earlier. Here’s the screen shot when I checked the “box scores” for our favorite greenhouse gasco2-2013-05-07whew! I know if I patiently wait, the CO2 concentration will rise above 400 ppm in earnest since CO2 concentrations have been increasing by about 2 ppm/year
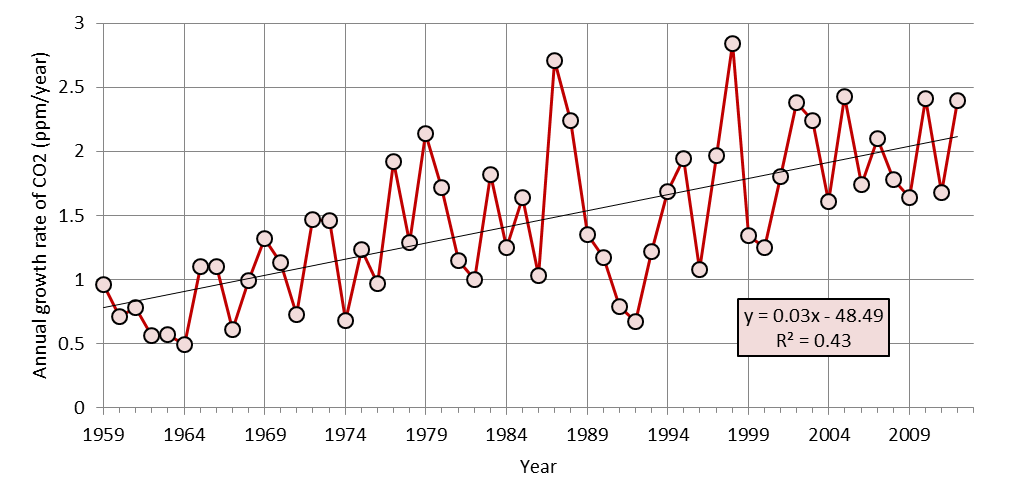
    Global growth rate of atmospheric concentration of CO2

    Global growth rate of atmospheric concentration of CO2 from 1959 to 2012 (data from NOAA ESRL in link below). 1959 is the start of in situ measurements. The best-fit line is overlaid for reference. You can see that the correlation coefficient is high. In this case, the R2 = 0.43 means that a line captures about 43% of the variance in the annual data. That, in turn, means that a line is a good approximation for predicting where we are going in the near-future.

    for a long time with some indication of acceleration in the last few years as the NOAA ESRL CO2 data repository data indicates. Finally, note that hourly measurements of CO2 have already jumped over 401 ppm at times as shown in this figure from Scripps. 400 ppm is inevitable, but what this means for the world is something that science is trying to figure out.mlo_one_week-2013-05-07