global warming

Your climate change

Advocacy in science seems to be on the rise. Maybe it’s that the USA administration is citing greater concern about the future state of our planet. Maybe scientists are just fed up that essentially the same message has been reiterated since the 1980s, and arguably even earlier than that. This is a great looking and simple petition by one of the IPCC chapter authors named Ranga Myneni. Dr. Myneni, who I’ve never met, is a professor at Boston University and has a fine set of credentials in peer-reviewed publications to go along with lead author status on the IPCC AR5 that will be released in 2014. There is no doubt he is an expert in the field. In fact, I use datasets related to vegetation land cover on that BU website. Sign his petition if you agree with the following statement which I received in a mass email from Professor Myneni that read as follows

There is now sufficient evidence that our way of living is causing unnatural changes in climate. Collectively, we own this damage and therefore we need to solve it together. Twenty five years have passed since the IPCC has been advising the policy makers regarding the hazards of climate change. Yet, there has been little meaningful action to solve this global problem affecting all life on Earth.

The solution lies in convincing policy makers that this is a priority for all citizens of the World – It is YOUR CLIMATE CHANGE also. Therefore, I started an online project to collect one billion signatures by Earth Day 2014 for a petition addressed to the Secretary-General of the United Nations to act judiciously and expeditiously on anthropogenic climate change.

Professor Myneni created a website called Your Climate Change. I signed the petition on that site. You can sign it too. Decide for yourself.
Land use in action

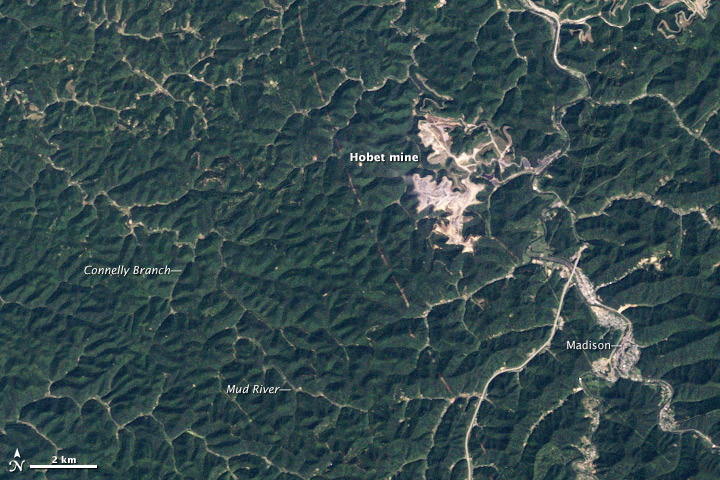
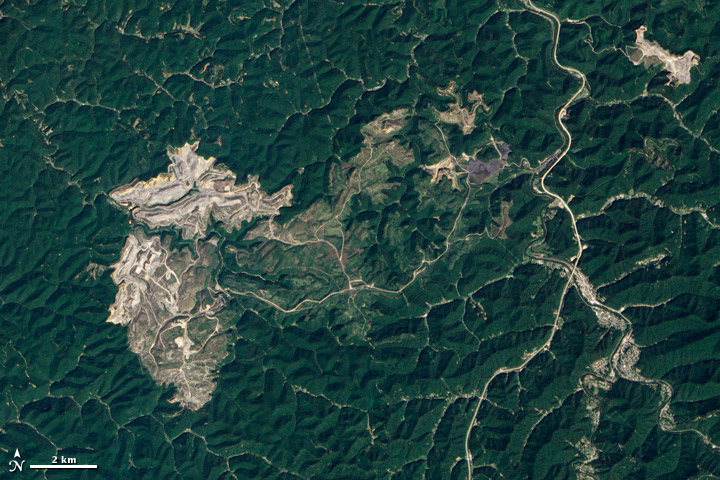
Externalities are the costs that are not incurred by coal mining operations, hydraulic fracturing (fracking), and oil sands extraction. Aside from the fossil fuel emissions from the burning of coal, oil, and natural gas for power generation, the extraction process bears huge costs that most of us are willing to overlook for the short-term economic benefits. If you happen to be in the vicinity of a mine, however, you probably are paying close attention to everything the company in charge is doing. One impact is land-use, and unfortunately for companies tearing into relatively remote regions of the Earth to feed our massive hunger to consume, NASA has some excellent Earth observing satellites. Satellites have been high above Earth since the 1970s and this is one image of a region in West Virginia, USA in 1984 hobet_19840917 with another image of the same region in 2012 hobet_20120920What do scientists do with this kind of imagery? Well, here is a the link to an amazingly clear image-animation of the process of removing a mountaintop in Appalachia (West Virginia, in this case) to uncover the coal. Related to the documentation of the mountaintop removal, is an image-animation of the land-use associated with the tar sands/oil sands extraction from Alberta’s boreal forest. Fracking doesn’t have as long a record, so NASA imagery doesn’t capture the results of this form of land-use. But states in the USA (including North Carolina) are lining up legislation to begin issuing permits for fracking. Proponents cite job creation and reduced greenhouse gas emissions (noting an important caveat to the 2nd point). Critics cite major concerns about just how long those economic gains will keep rolling in before locals are left with an environmental mess to clean up without help from the deep industrial pockets that created the mess.
Resources to understand sea level rise

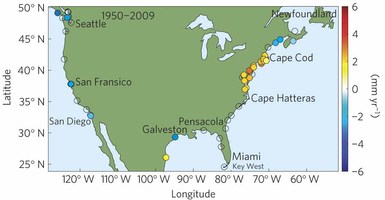
Whereas the global warming app I mentioned is based on analysis of data we already have, the future projections of the impacts of global warmings are ridiculously interesting, speculative, and terrifying at the same time. Hurricane Sandy and some of the stories that emerged from the storm surge – including the story of a building in Brooklyn that happened to be building where a storm surge swept through but was undamaged because the the contractors were building with the knowledge that sea level rise will dramatically affect even NYC (building for the future added $550k to the $100 million budget, says the article) and including a very informative interview with a well-known and respected NASA scientist at NOAA’s relatively new Climate Service website – showed that sea level rise is very much on the mind of many. Yet another great webapp published by the New Scientist shows two examples of SLR and how the non-uniform the impacts are expected to be. This is a projection into the future, but many recent studies, like this one based on tide gauge data, agree with non-uniformity in SLR. A great snippet from that Nature Climate Change publication (which was subject to peer-review before publication) is this one nclimate1597-f2, which shows clearly that the West Coast and East Coast of the USA have already experienced much different responses to SLR. The data seems to be in line with the models, where a model projection is what is shown in the webapp. Another great visualization!
Policy leadership on issues related to global warming

President Obama continues to steam ahead in the beginning of his 2nd term. His State of the Union speech was really well-done, and followed on the tone he set in his Inaugural Address. Not all of the speech was about climate (full transcript), but it is clear that even in the face of sequestration, if you are concerned about the impacts of global warming, then now is the time to send a letter to your representative, senator, and even our president to let them know you support the forward-thinking policy. Here is a snippet of the part of the speech most relevant to addressing the impacts of global warming. I added links to points that verify or provide a more complete perspective on statements President Obama made.

Today, no area holds more promise than our investments in American energy. After years of talking about it, we’re finally poised to control our own energy future. We produce more oil at home than we have in 15 years. We have doubled the distance our cars will go on a gallon of gas and the amount of renewable energy we generate from sources like wind and solar, with tens of thousands of good, American jobs to show for it. We produce more natural gas than ever before, and nearly everyone’s energy bill is lower because of it. And over the last four years, our emissions of the dangerous carbon pollution that threatens our planet have actually fallen. But for the sake of our children and our future, we must do more to combat climate change.

Now, it’s true that no single event makes a trend. But the fact is, the 12 hottest years on record have all come in the last 15. Heat waves, droughts, wildfires, floods, all are now more frequent and more intense. We can choose to believe that Superstorm Sandy, and the most severe drought in decades, and the worst wildfires some states have ever seen were all just a freak coincidence. Or we can choose to believe in the overwhelming judgment of science and act before it’s too late.

Now, the good news is, we can make meaningful progress on this issue while driving strong economic growth. I urge this Congress to get together, pursue a bipartisan, market-based solution to climate change, like the one John McCain and Joe Lieberman worked on together a few years ago. But if Congress won’t act soon to protect future generations, I will. I will direct my cabinet to come up with executive actions we can take, now and in the future, to reduce pollution, prepare our communities for the consequences of climate change, and speed the transition to more sustainable sources of energy.

Now, four years ago, other countries dominated the clean-energy market and the jobs that came with it. And we’ve begun to change that. Last year, wind energy added nearly half of all new power capacity in America. So let’s generate even more. Solar energy gets cheaper by the year. Let’s drive down costs even further. As long as countries like China keep going all-in on clean energy, so must we.

Now, in the meantime, the natural gas boom has led to cleaner power and greater energy independence. We need to encourage that. That’s why my administration will keep cutting red tape and speeding up new oil and gas permits. That’s got to be part of an all-of-the-above plan. But I also want to work with this Congress to encourage the research and technology that helps natural gas burn even cleaner and protects our air and our water. In fact, much of our newfound energy is drawn from lands and waters that we, the public, own together. So tonight, I propose we use some of our oil and gas revenues to fund an Energy Security Trust that will drive new research and technology to shift our cars and trucks off oil for good. If a nonpartisan coalition of CEOs and retired generals and admirals can get behind this idea, then so can we. Let’s take their advice and free our families and businesses from the painful spikes in gas prices we’ve put up with for far too long. I’m also issuing a new goal for America: Let’s cut in half the energy wasted by our homes and businesses over the next 20 years.

I do feel like this part of his speech does make some concessions and perhaps side steps the simple fact that the USA has to lead a GLOBAL effort to eliminate carbon emissions. This does not mean using natural gas instead of coal in the USA is a good thing because coal is still being mined and sent elsewhere (Europe) and the long-term health/environmental costs on top of the costs of more carbon in the atmosphere (natural gas combustion still releases carbon even if it’s less than coal – good article here) are a powerful part of that equation that essentially are being neglected for the economy. Policy might simply be lagging the science, but the science is becoming more and more stark, while policy suffered from years of delay when action was needed. I know climate is not the only issue on the table, but it is the clearest issue when trying to understand the future. Every year we delay will make any level of action not only more difficult economically, but will also reduce the impact of that action.

Resources to understand global warming

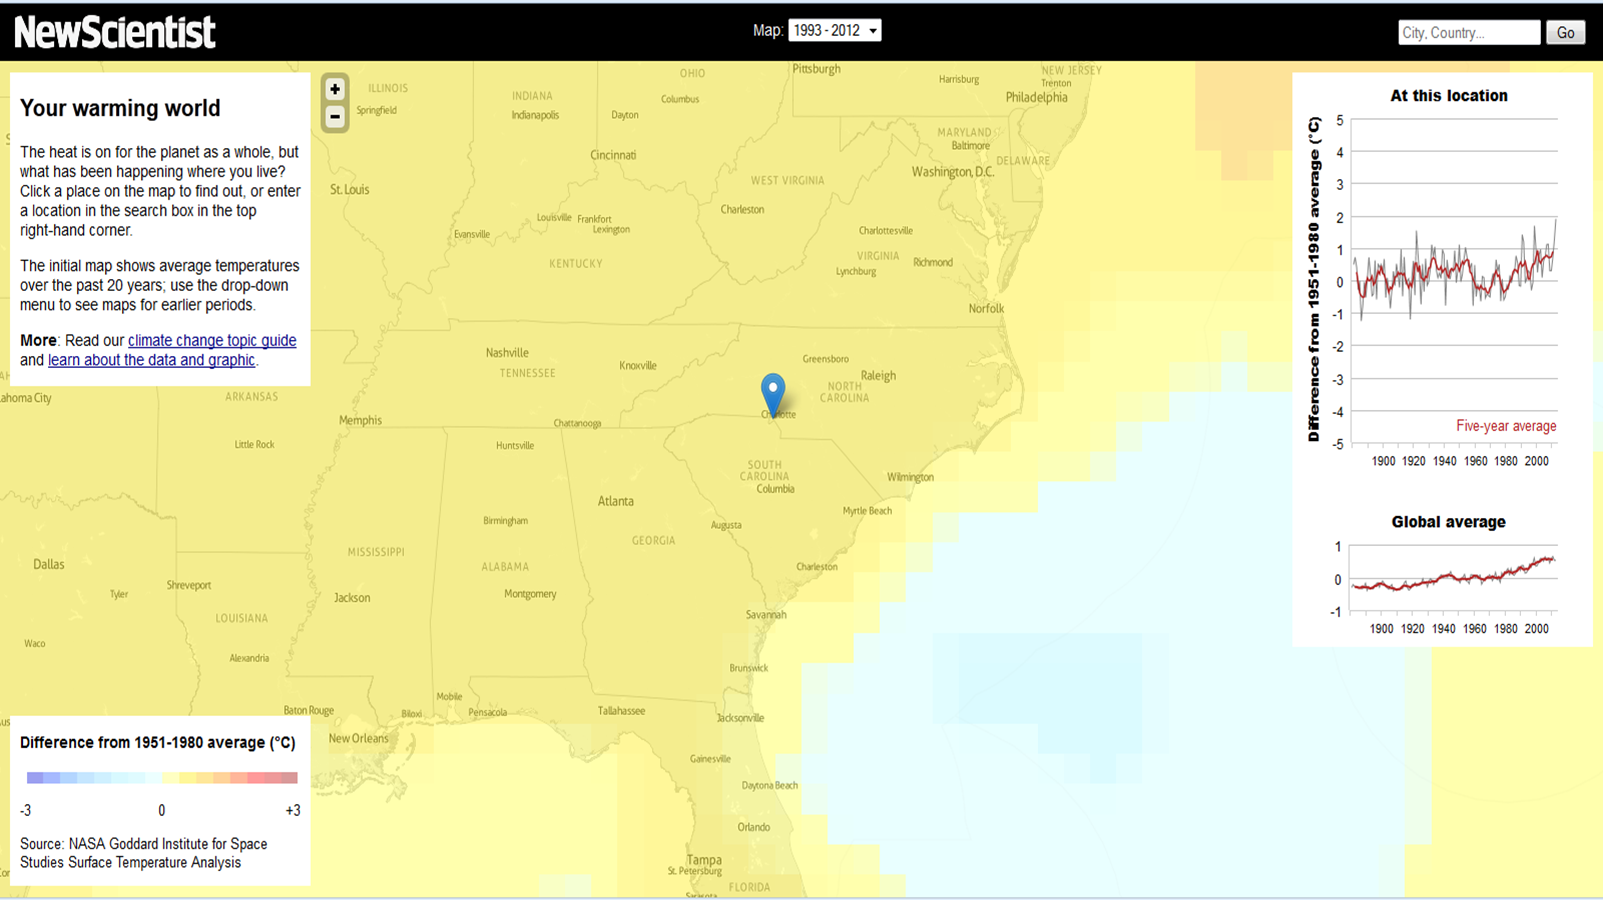
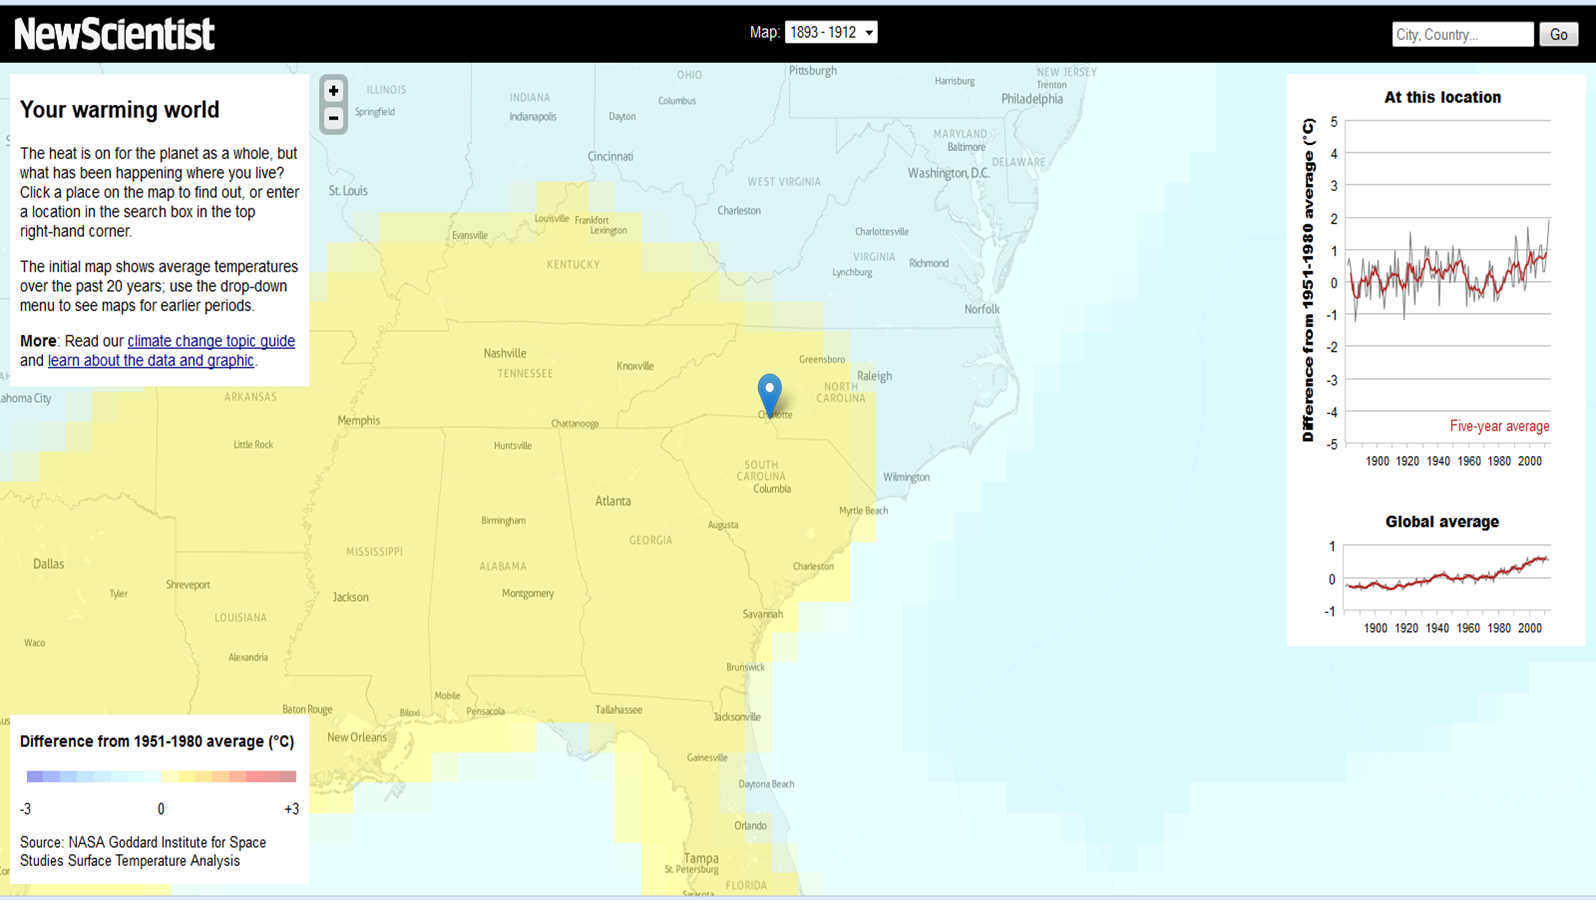
There is a treasure trove of information and misinformation about global warming on the mighty internet. I try to sift through these as I prepare for effective ways to empower students or at least generate discussion. Here are a couple of new-ish resources that visualize the NASA GIStemp gridded temperature anomaly data set, which are described in great detail on that website but also in the peer-reviewed science literature. The New Scientist (UK popular science magazine) created this webapp to allow anyone to point and click on a location to see how the temperature has changed since about 1890. Here’s a snippet of the Southeast USA anomaly averaged from 1893-1912 warming-southeast-1890and then from 1993-2012 warming-southeast-2000The global warming trend is presented on the right side, while the temperature trend for the specific location is right above it. What’s really nice is the pop-up window that the app opens when you hover over that location-specific temperature trend. You can see the data that’s plotted! Admittedly, it’s pretty easy to get from NASA GISS as indicated via the links on the webapp itself, but still, it’s a great effort by the New Scientist to make sure any person who wants to can reproduce the analysis. And, most importantly, the app itself is a really accessible way to “see” global warming. Other temperature data sets (HadCRU, NOAA NCDC, and a couple of others) have trends that are very similar to NASA GISS – if I find a link showing this comparison, I will post it.

Where the US coal is going

Many in North Carolina are aware of the move in the energy industry from coal to natural gas (example 1, and others from photos with telling captions at example 2, example 3, example 4, etc.). Fracking has opened up a huge reserve of natural gas, driving down consumer costs and keeping the individual happy while essentially ignoring the larger health and environmental costs to society down the line. Leave that part alone and focus on coal. The US mines coal, but what is the incentive for continued mining? Certainly it is not for the sake of communities and ecosystem as discussed in another sobering study about the true costs of a very dirty form of energy. Glancing at the Washington Post this morning reveals why coal is still being mined in the US, and hints about why there is no monetary incentive to slow frakking in the US. Here’s the article. One part of the article says

Europe’s use of the fossil fuel spiked last year after a long decline, powered by a surge of cheap U.S. coal on global markets and by the unintended consequences of ambitious climate policies that capped emissions and reduced reliance on nuclear energy.

This is a worrying development that is happening in response to two things: 1. US fracking for natural gas driving down US coal prices and 2. A country that shuts down old nuclear plants in response to the disaster in Japan. Neither 1 or 2 by itself is a problem, but the far-reaching impacts of violently tearing into the world are something are completely ignored by industries and by the consumers that demand low-cost energy sources. Economics is trumping common sense. Another quote from the articles is

Demand for coal in Germany has been rising since a May 2011 move to phase out nuclear power by 2022. The shutdown was spurred by the nuclear meltdown at the Fukushima Daiichi plant in Japan as well as long-standing German concerns about safety. But nuclear energy, which is low in greenhouse gas emissions, has been partially replaced by brown coal. Lignite supplied 25.6 percent of Germany’s electricity in 2012, up from 22.7 percent in 2010. Hard black coal supplied an additional 19.1 percent last year, and it was also on the rise.

The economy will likely improve (in the US and Europe in the case of the Washington Post article), and as the article points out, US carbon emissions from electricity generation are down to 1992 levels, but my studies of the climate system as I prepare for teaching reveal that this is likely a short-term benefit with long-term costs. Global warming is still global, and global carbon emissions are what matter. Global carbon emissions continue to increase, as described in this source. Google ‘global carbon emissions’ for many more groups tracking or discussing carbon. The simple evidence suggests that carbon-based energy is nowhere close to leaving the scene.

Climate change and leadership

Below is a wonderful quote from the President of the USA Barack Obama during his Inaugural Address today (source: Washington Post). It sounds like the USA is ready to start moving forward on much-needed federal action on global warming:

We will respond to the threat of climate change, knowing that the failure to do so would betray our children and future generations. Some may still deny the overwhelming judgment of science, but none can avoid the devastating impact of raging fires, and crippling drought, and more powerful storms. The path towards sustainable energy sources will be long and sometimes difficult. But America cannot resist this transition; we must lead it. We cannot cede to other nations the technology that will power new jobs and new industries – we must claim its promise. That is how we will maintain our economic vitality and our national treasure – our forests and waterways; our croplands and snowcapped peaks. That is how we will preserve our planet, commanded to our care by God. That’s what will lend meaning to the creed our fathers once declared.

I highlighted the quote because it has not been common to hear from the federal government about progressive action on mitigating the impacts of global warming. President Obama’s comments are, as I said before, much-needed. I hope all successive presidents maintain this viewpoint on global warming – it’s an issue that deletes party lines.

USA in December remains much warmer than average

A blowout in sports – whether it’s baseball, football, basketball, or soccer – is usually boring to watch. By blowout, I mean a game when one team obliterates the other. You know, 14-2 in baseball, 40-7 in football, etc. But in climate, the month-to-month ups and downs in temperature departures, are one example when a blowout is actually more fascinating to watch than another month of the “climate normal“.

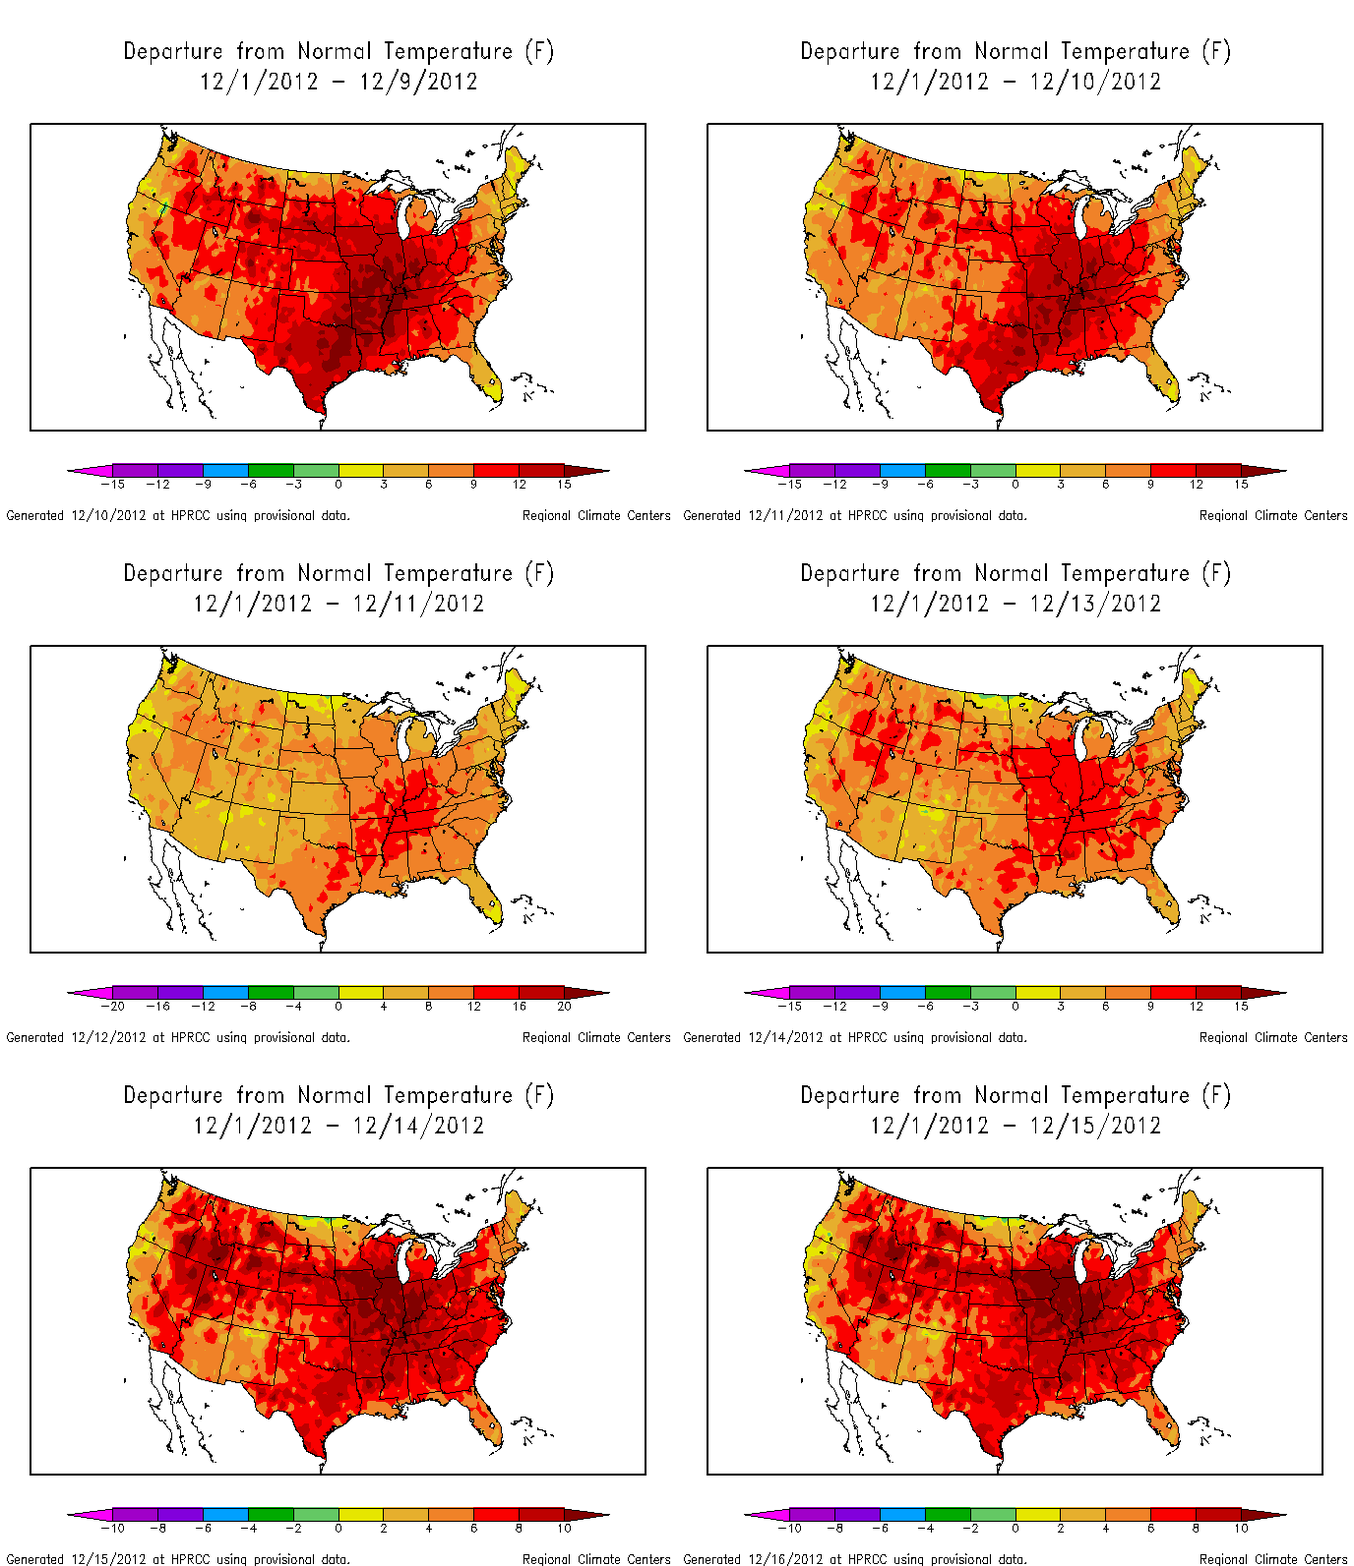
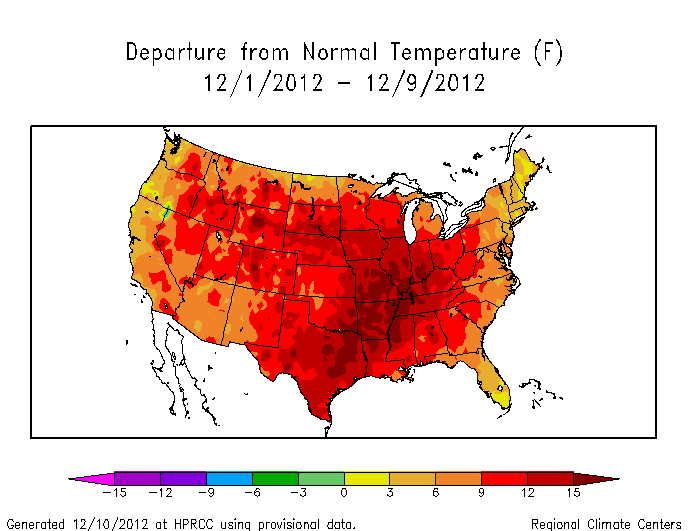
As I mentioned earlier, December 2012 is setting the year 2012 to be a blowout in terms of the “competition” between years to be the warmest on the 118 year record. Here’s the updated evolution of December 2012 temperature departures from figures I got from the HPRCC map maker and laced together for an animated look at the month.

The most obvious feature is the continuing large and positive temperature departures for most of the country. You have to be a little careful because the figures have shifting colorbars on the bottom. Dark red doesn’t mean the same thing on every figure, but the message is clear as day. December is much much warmer than usual. The last week or so has continued the trend, although you do see the effect of the cold frontal passage around December 11-12 in the animation. Stay tuned, but based on a quick look at long-term weather model forecasts, I wouldn’t expect a dramatic change in the weather regime until at least December 25.

Shattering the temperature record?

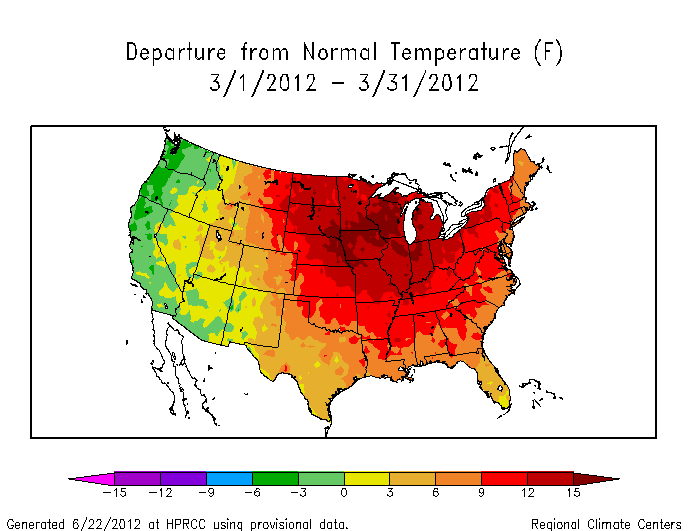
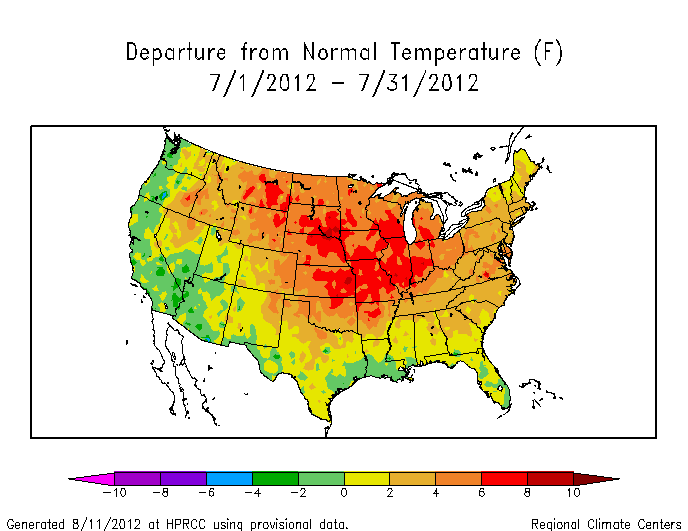
Glancing through the temperature anomalies of the last year, it’s clear we’re heading – barrelling really – towards a record hot year. Temperature data is collected and archived very quickly through various climate centers. The High Plains Regional Climate Center (HPRCC) has a particularly fluid interface for quickly assessing the state of the climate over different time and space (or spatiotemporal) scales. The USA as a whole experienced a record hot March and July in 2012, as listed in the table here. Records weren’t broken in every single state of course, but the records were broken when all the temperatures were averaged together. Here’s the story though. December 2012 is set to be the final nail in the plaque on the wall that says “HOTTEST YEAR ON RECORD: 1998 2012” and at this point (9 days into the month), December 2012 will not only be the nail, but will help 2012 shatter the temperature record. Look at these anomalies figures produced using the HPRCC tool for March, July, and so far for December:


Without even reading a number, you know that the deep red color for the anomaly from December 1-9 implies that it’s much hotter than the average temperature for December 1-9**. There’s hardly a speck of any the green or yellow that represents near normal temperature! But let’s not overreact. Whether this early trend will continue depends on the weather. All things being equal, weather over the entire month will probably moderate the unusual warmth seen so far in December. However, human activities have fundamentally changed how the concept of “all things being equal” applies to weather, so better to look at what weather models are saying rather than just assuming… Near-term weather forecasts suggests that the first half of the month will be more of the same. Long-term weather forecasts for the month (for example, clicking on the options for 100 hr+ forecast times) suggest a nor’easter may develop around Dec 16 and subsequently affect the mid-Atlantic Dec 17-18, but even that weather system seems to bring rain rather than snow (use the same forecast tool and “precip type” option to see that). Regardless, there is no chance of widespread snowmen to cool things down before at least December 15. Odds are in favor of a shattered temperature record on New Years Day.

*on record is the 118 year temperature record
**1981-2010 is the period that any month on the 118 year record is compared to. HPRCC call it the Climate Normal. NOAA NCDC call it the base period. Both use the same range of 30 years, which is a typical length of a climate-relevant – as opposed to weather – temperature dataset

2012 Temperatures in North Carolina and USA

The big news, if you’re paying attention the inexorable increase in temperatures, is that the biggest contributor to fossil fuel carbon (the USA) is experiencing the hottest year in 118 years. We have one month remaining this year, but the record will be set unless the USA suddenly experiences the coldest December in 118 years (it won’t – we’re well on our way to a warmer than average December and there’s a weak-moderate El Nino in place right now too which tends to result in more mild winters for at least part of the USA). Certainly many locations in the contiguous USA will be cold, but it’s not the cold that matters though. It’s the comparison of the current temperature to an average of past temperatures that really highlights relative warmth or cold. Mining what has quickly become my favorite climate data source, at least for the USA, i went to the NCDC website and pulled down the data to look at how temperatures of our home state compare to those of our home country. Here’s what I got:

             North Carolina   NC Climate Division 5*  Contiguous USA
  January    +2.9 (92)        +3.1 (94)               +5.8 (115)
 February    +2.7 (88)        +2.3 (83)               +3.9 (104)
    March    +8.7 (117)       +9.8 (117)              +8.8 (118)
    April    +1.1 (80)        +1.7 (88)               +3.7 (116)
      May    +2.9 (108)       +2.9 (106)              +3.3 (117)
     June    -1.5 (21)        -1.5 (26)               +2.1 (107)
     July    +3.2 (117)       +2.4 (111)              +3.3 (118)
   August    -0.4 (50)        -1.3 (22)               +1.7 (106)
September    -0.9 (47)        -1.6 (36)               +1.4 (96)
  October    -0.6 (54)        -1.5 (38)               -0.3 (46)
 November    -3.6 (11)        -3.6 (10)               +2.0 (99)
 December    TBD (TBD)        TBD (TBD)               TBD (TBD)

*includes Charlotte and Mecklenburg County

The numbers with the + and – are the anomaly (departure) of that month’s temperature from the 20th Century average for that month. The numbers in parentheses are how the particular month for the particular region ranks (118 is hottest, 1 is coldest following NCDC protocol). The regions are NC, a smaller part of NC that includes CharMeck, and the USA minus Hawaii and Alaska. So, if you’re from North Carolina and can’t wait to have the dinnertime conversation with your friend/relative about how global warming is a joke/hoax/conspiracy, here is what you do. Pull up that table and you can heartily agree that, yes, North Carolina has been cooler than average, particularly since August. CharMeck (middle column essentially) has pretty much been the same, maybe even cooler. But then there’s the USA. The USA had below average temperatures in October, but the warmth has otherwise been shockingly constant. March and July 2012 were both the hottest in the 118 year record. On January 1, it’ll be clear that the USA has been warmer than it has been in over a century. North Carolina has finished cooler than average, but as I pointed out before, it was the warmth in the beginning of the calendar year that set the stage. And GLOBAL warming has never been about the warming or cooling of a particular US State – it is the response of an entire planet to the energy imbalance imposed on it by human activities. The data is mounting up though and the temperature trends of regions like the USA are slowly creeping out of the noise of the day-to-day variability.