global warming

Remembering the warmth with temporal averaging

It’s been cool in North Carolina and in Charlotte in August and September 2012, as I talked about on one of my posts. In that post, I said that if you really want to know whether the temperatures you are experiencing are representative of the bigger picture, you can “zoom out” from the city level (or Climate Division) to the state level and even to the country level. This is easy with the NCDC website which archives USA climate data. Another way to think about the temperatures in a particular month (like September 2012) is to zoom out in time. In other words, take a longer time average to see whether the temperature averaged over the last few months or even the whole year are at all like the temperature you are experiencing in the here and now. (we’re still talking about monthly temperature, not the weather).
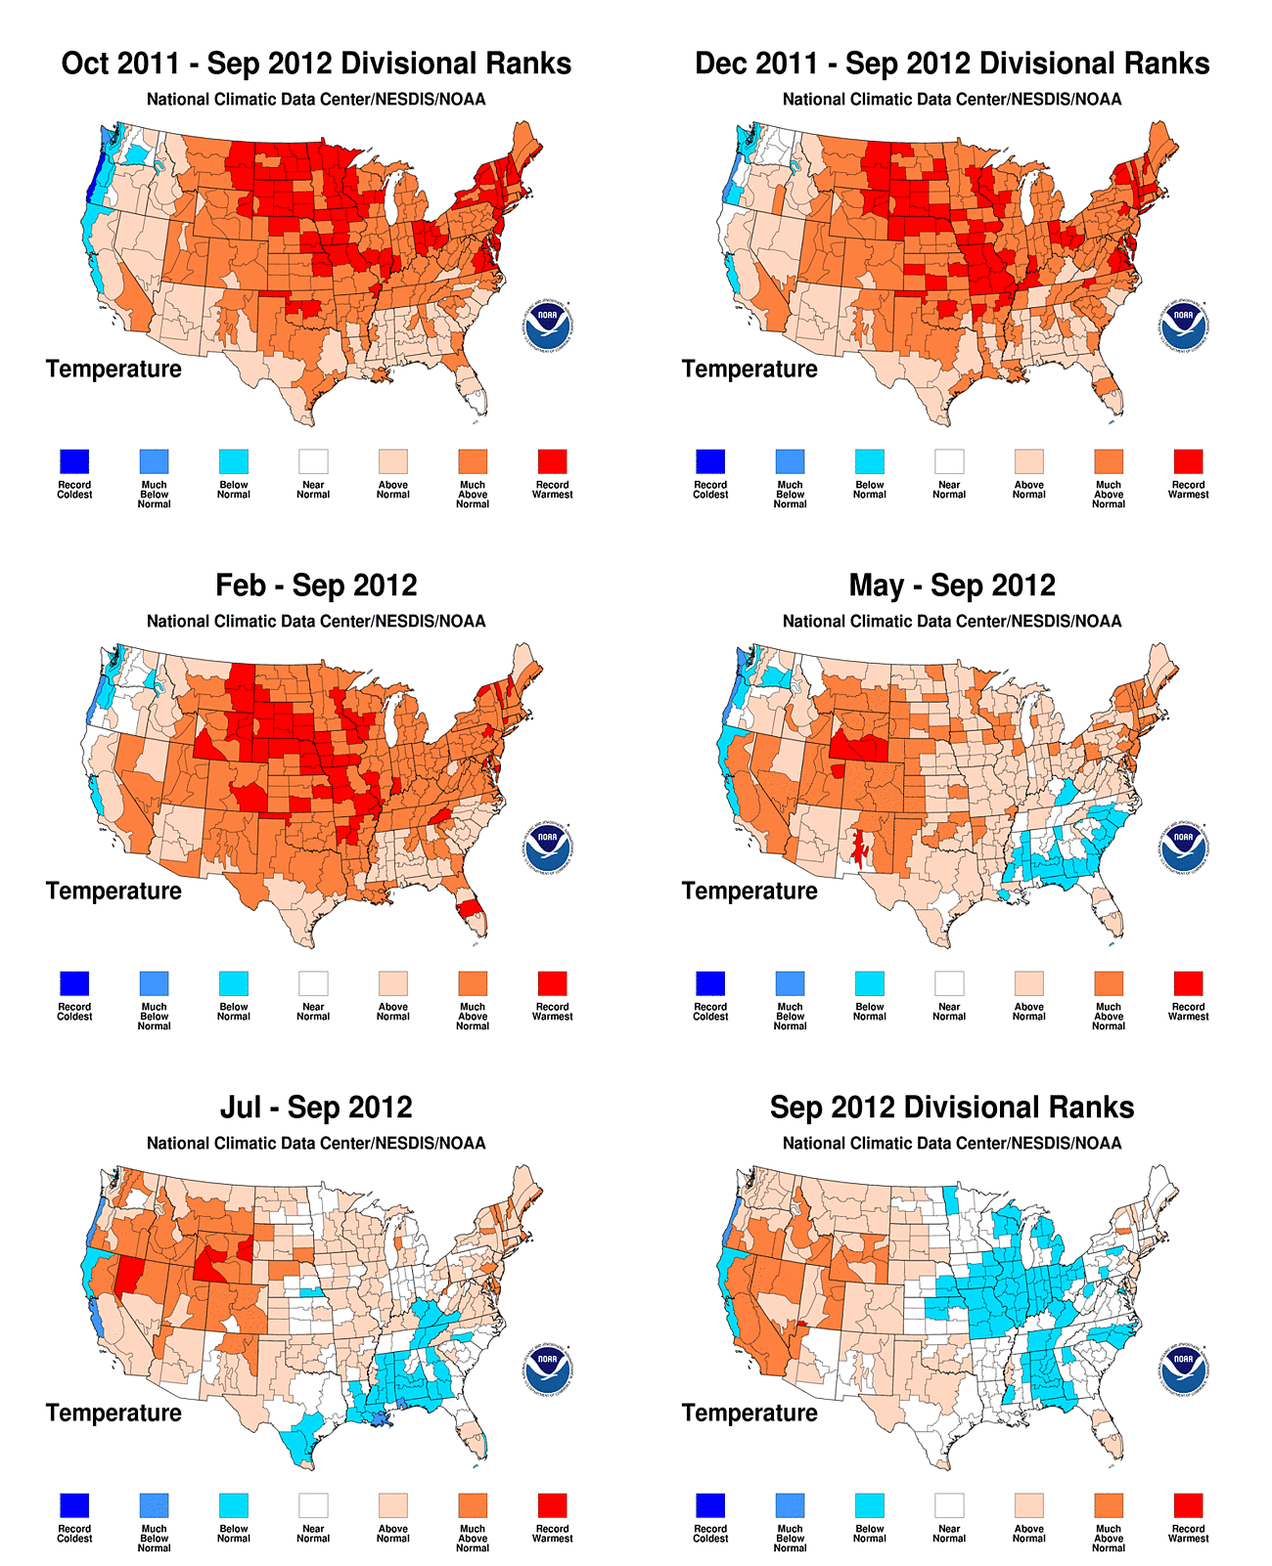
Using figures that you can get at NCDC, I made the animation above. The figure shows the temperature averaged over progressively fewer months (starting with 12 months up to Sep 2012 and going down to just Sep 2012). I think the data in the figure shows that the temperatures departures over the last year (Oct 2011 to Sep 2012) in North Carolina were dominated by unusually large warm anomalies back in the winter months, from about Oct 2011 to Mar 2012. Starting in May 2012, the temperature anomalies in NC were below average, but these below-average temperatures we’ve been experiencing are swamped by the above-average temperatures from the what we did experience (but may have forgotten). When you look at the trend in the country as a whole, and focus on the Oct 2011 to Sep 2012 image when it pops up, you can see that most of the country is very warm compared to average.

Cool in North Carolina, but not the USA

Between all the various climate excitement in the news – like record-low Arctic sea ice – temperature measurements continue to be collected. A really great webpage to actually examine the temperature data is at the NOAA National Climatic Data Center. The NCDC data shows that in 2012

           North Carolina   NC Climate Division 5*  Contiguous USA
     July  80.5 (+3.2)      81.1 (+2.4)             77.2 (+3.3)
   August  75.7 (-0.4)      76.1 (-1.3)             74.6 (+1.7)
September  69.8 (-0.9)      70.3 (-1.6)**           67.0 (+1.4)

*includes Charlotte and Mecklenburg County
**corrected after an NCDC website glitch which originally had values of 74.1 (-1.5)

where the bigger number under each header is the avereage temperature for the particular month in degrees Fahrenheit, while the number in the parentheses is the departure (or anomaly) of the month to the average temperature for that month for the 20th century (1900-1999). North Carolina, like most of the USA, had a really warm July 2012 and the country experienced the warmest July in the 118 years of records. On the other hand, August and September temperatures in North Carolina this year were about a half degree to nearly a full degree less than the 20th century average temperatures. These much cooler-than-average temperatures were even more pronounced in southern North Carolina, which I show above as NC Climate Division 5. This climate division includes Charlotte and Mecklenburg County.

This is a great example of how even when the local temperature for a particular month is below or above average, this may not be true when you examine other parts of the country, or in the case of Charlotte, other parts of the state. This same analogy is true when comparing regional (like USA) to global temperature trends. The summary is that even though NC had a cooler than average Aug-Sep, the USA on the whole still experienced a warmer than average August and September to pile on to the warmest July on record.

Changes to Global Environmental Change webpage

Categories: Group News

just a few notes about the changes to my teaching webpage for my Global Environmental Change (ESCI 3000 this semester – Fall 2012, expected to be ESCI 3101 by Fall 2013) webpage. i updated just about everything there so the interface would be more useful for students, but there are many links to climate-related internet sources for discussion, books, visualizations, and of course DATA related to climate science. i will point out that the NCDC websites and the CMIP5 websites are especially useful. CMIP5 is family of model experiments that will support IPCC AR5 which is being written and revised this year and expected to be published sometime in 2013. CMIP3, I think, were the model experiments that supported IPCC AR4 publications in 2007.