New research paper was accepted by the Journal of Environmental Management.
Title: Uncertainties in mapping forest carbon in urban ecosystems
Abstract:
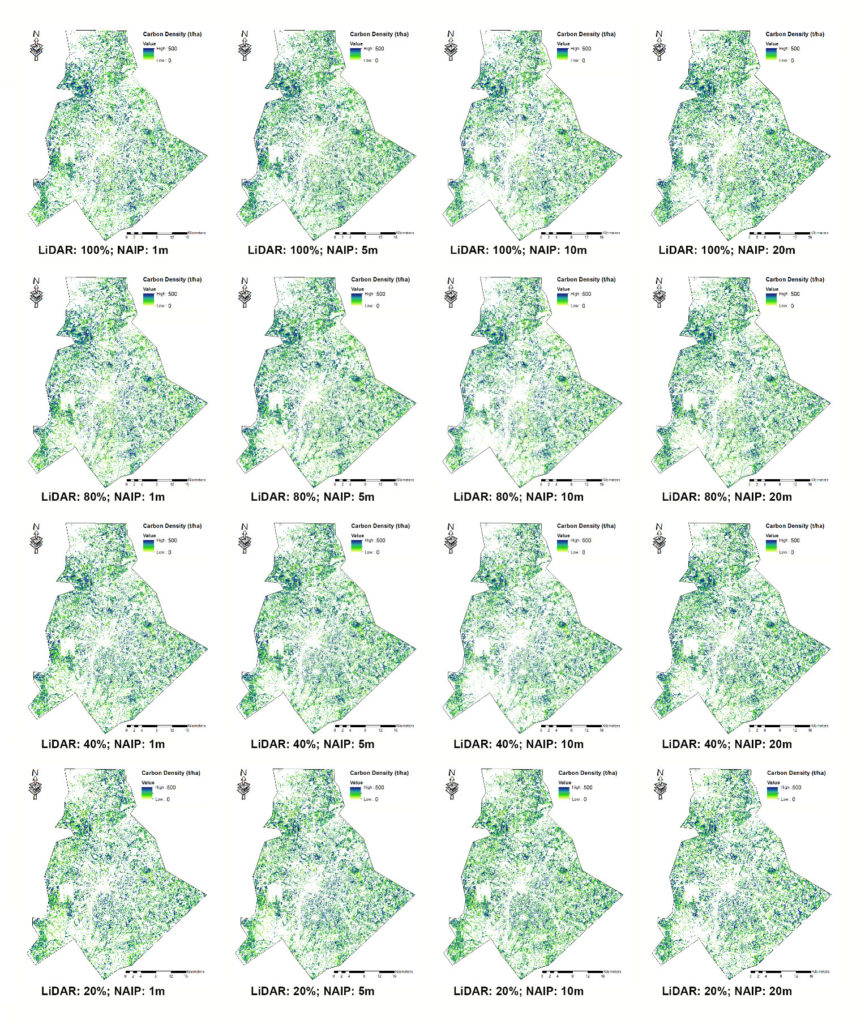
Spatially explicit urban forest carbon estimation provides a baseline map for understanding the variation in forest vertical structure, informing sustainable forest management and urban planning. While high-resolution remote sensing has proven promising for carbon mapping in highly fragmented urban landscapes, data cost and availability are the major obstacle prohibiting accurate, consistent, and repeated measurement of forest carbon pools in cities. This study aims to evaluate the uncertainties of forest carbon estimation in response to the combined impacts of remote sensing data resolution and neighborhood spatial patterns in Charlotte, North Carolina. The remote sensing data for carbon mapping were resampled to a range of resolutions, i.e., LiDAR point cloud density – 5.8, 4.6, 2.3, and 1.2 pts/m2, aerial optical NAIP (National Agricultural Imagery Program) imagery – 1, 5, 10, and 20 m. Urban spatial patterns were extracted to represent area, shape complexity, dispersion/interspersion, diversity, and connectivity of landscape patches across the residential neighborhoods with built-up densities from low, medium-low, medium-high, to high. Through statistical analyses, we found that changing remote sensing data resolution introduced noticeable uncertainties (variation) in forest carbon estimation at the neighborhood level. Higher uncertainties were caused by the change of LiDAR point density (causing 8.7-11.0% of variation) than changing NAIP image resolution (causing 6.2-8.6% of variation). For both LiDAR and NAIP, urban neighborhoods with a higher degree of anthropogenic disturbance unveiled a higher level of uncertainty in carbon mapping. However, LiDAR-based results were more likely to be affected by landscape patch connectivity, and the NAIP-based estimation was found to be significantly influenced by the complexity of patch shape.
Fig 1. Forest carbon maps derived from four resolutions (1, 5, 10 and 20 m) of NAIP images, four densities of LiDAR point clouds (100%, 80%, 40% and 20% of the original data).
