The Laboratory for Remote Sensing and Environmental Change (LRSEC)
An Interdisciplinary Research Group Using Remote Sensing and Geospatial Science to Understand Landscape Change
  • Home
  • Publications
  • Research Products
  • Team
    • Dr. Gang Chen
    • Chenyu Xing
    • Ravi Thapaliya
    • Rachel Caron
    • Justin Erlick
    • Austin Barbee
    • Carter Mayhew
    • Sam Penry
  • Prospective Students
  • Teaching
  • News

Latest News in LRSEC

  • New Faces in the Lab: Alden, Carter, and Sam August 27, 2025
  • Welcome Austin Barbee to join LRSEC October 3, 2024
  • Welcome Justin Erlick to join the lab September 16, 2024

Contact Lab Director

Dr. Gang Chen
Address: McEniry 446, 9201 University City Blvd, Charlotte, NC 28223, USA (35°18'26"N 80°43'48"W)
Email: Gang.Chen 'at' charlotte.edu

Links

  • Department of Earth, Environmental and Geographical Sciences
  • College of Humanities & Earth and Social Sciences
  • University of North Carolina at Charlotte

Updates

New research article accepted by RSE

June 01, 2019 by Gang Chen
Categories: Updates

He, Y., G. Chen, C. Potter, and R.K. Meentemeyer (in press). Integrating multi-sensor remote sensing and species distribution modeling to map the spread of emerging forest disease and tree mortality. Remote Sensing of Environment.

Abstract:

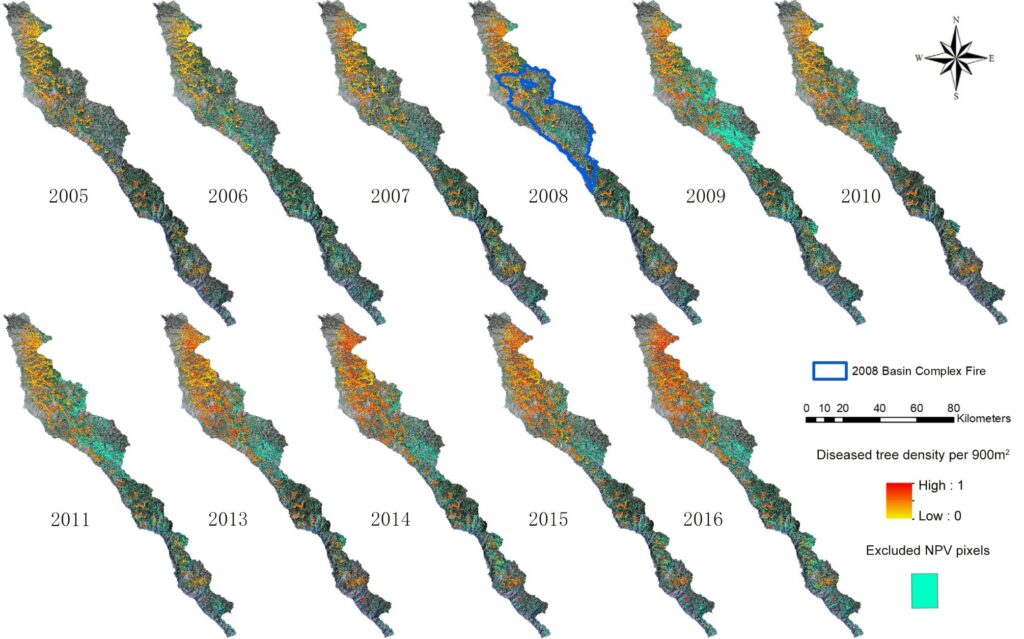
Forest ecosystems have been increasingly affected by a variety of disturbances, including emerging infectious diseases (EIDs), causing extensive tree mortality in the Western United States.Especially over the past decade, EID outbreaks occurred more frequently and severely in forest landscapes, which have killed large numbers of trees. While tree mortality is observable from remote sensing, its symptom may be associated with both disease and non-disease disturbances (e.g., wildfire and drought). Species distribution modeling is widely used to understand species spatial preferences for certain habitat conditions, which may constrain uncertain remote sensing approaches due to limited spatial and spectral resolution. In this study, we integrated multi-sensor remote sensing and species distribution modeling to map disease-caused tree mortality in a forested area of 80,000 ha from 2005 to 2016. We selected sudden oak death (caused by pathogen P. ramorum) as a case study of a rapidly spreading emerging infectious disease, which has killed millions of oak (Quercus spp.) and tanoak (Lithocarpus densiflorus) in California over the past decades. To balance the needs for fine-scale monitoring of disease distribution patterns and satisfactory coverage at broad scales, our method applied spectral unmixing to extract sub-pixel disease presence using yearly Landsat time series. The results were improved by employing the probability of disease infection generated from a species distribution model. We calibrated and validated the method with image samples from high-spatial resolution NAIP (National Agriculture Imagery Program), and hyperspectral AVIRIS (Airborne Visible/Infrared Imaging Spectrometer) sensors, Google Earth® imagery, and field observations. The findings reveal an annual sudden oak death infection rate of 7% from 2005 to 2016, with overall mapping accuracies ranging from 76% to 83%. The integration of multi-sensor remote sensing and species distribution modeling considerably reduced the overestimation of disease effects as compared to the use of remote sensing alone, leading to an average of 26% decrease in detecting disease-affected trees. Such integration strategy proved the effectiveness of mapping long-term, disease-caused tree mortality in forest landscapes that have experienced multiple disturbances.

Fig. Spatial distribution of the estimated density of sudden oak death-caused tree mortality per 900 m2 from 2005 to 2016.

Special Issue "Mapping Forest Dynamics using Multi-Source Remote Sensing"

March 13, 2019 by Gang Chen
Categories: Updates

Dear Colleagues,

Forest ecosystems are increasingly affected by a variety of environmental and anthropogenic disturbances, such as fire, drought, insect and disease outbreaks, logging, and urban development. Although almost none of those disturbances are new, a growing number of studies confirmed that their intensity and frequency have substantially increased over the past decades. Consequently, a prior disturbance regime is likely to influence the response of a forest ecosystem to a new disturbance, resulting in complex, interacting disturbances. While single sensors in remote sensing often face challenges to capture such disturbances and the process of post-disturbance recovery, a growing fleet of sensors with diverse spatial, temporal, spectral and radiometric resolutions has significantly augmented our earth observation capabilities.

This Special Issue aims to review and synthesize the latest, leading-edge advances in mapping forest dynamics using multi-source remote sensing. Original research articles are solicited over a wide range of topics which may focus on, but are not limited to:

  • Mapping large-scale disturbances causing extensive tree damage (e.g., changes in tree structure, canopy cover, biomass and carbon storage)
  • Monitoring stresses affecting forest health (e.g., photosynthesis and phenology)
  • Assessing causes of disturbances/stresses
  • Forest recovery mapping and analysis
  • Integrating a new generation of sensors for tracking forest dynamics
  • New strategies or algorithms to synergize multi-source data

Deadline for manuscript submissions: 30 November 2019 

See link to the special issue webpage: https://www.mdpi.com/journal/remotesensing/special_issues/forest_dynamics

Guest Editors

Dr. Gang Chen
Laboratory for Remote Sensing and Environmental Change, Department of Geography and Earth Sciences, University of North Carolina at Charlotte, Charlotte, NC 28277, USA

Dr. Kaiguang Zhao
Ohio Agricultural Research and Development Center, School of Environment and Natural Resources, The Ohio State University, Wooster, OH 44691, USA

New burn severity research accepted by RSE

November 11, 2018 by Gang Chen
Categories: Updates

A Disturbance Weighting Analysis Model (DWAM) for Mapping Wildfire Burn Severity in the Presence of Forest Disease

Abstract
Forest ecosystems are subject to recurring fires as one of their most significant disturbances. Accurate mapping of burn severity is crucial for post-fire land management and vegetation regeneration monitoring. Remote-sensing-based monitoring of burn severity faces new challenges when forests experience both fire and non-fire disturbances, which may change the biophysical and biochemical properties of trees in similar ways. In this study, we develop a Disturbance Weighting Analysis Model (DWAM) for accurately mapping burn severity in a forest landscape that is jointly affected by wildfire and an emerging infectious disease – sudden oak death. Our approach treats burn severity in each basic mapping unit (e.g., 30 m grid from a post-fire Landsat image) as a linear combination of burn severity of trees affected (diseased) and not affected by the disease (healthy), weighted by their areal fractions in the unit. DWAM is calibrated using two types of inputs: i) look-up tables (LUTs) linking burn severity and post-fire spectra for diseased and healthy trees, derived from field observations, hyperspectral sensors [e.g., Airborne Visible InfraRed Imaging Spectrometer (AVIRIS)], and radiative transfer models; and ii) pre-fire fractional maps of diseased and healthy trees, derived by decomposing a pre-fire Landsat image using Multiple Endmember Spectral Mixture Analysis (MESMA). Considering the presence of tree disease in DWAM improved the overall map accuracy by 42%. The superior performance is consistent across all three stages of disease progression. Our approach demonstrates the potential for improved mapping of forest burn severity by reducing the confounding effects of other biotic disturbances.

Dipa and Sam join the lab

September 29, 2018 by Gang Chen
Categories: Updates

LRSEC welcomes two MA students – Dipa and Sam – to join the lab!

Dipa Dutta has a strong physical geography and remote sensing background. She graduated from Jadavpur University, India.

Sam Nickerson came to us with a B.S. in Environmental Studies and Geography from Keene State College. He has a strong background in GIScience and spatial ecology.

New paper appears in Ecological Indicators

August 10, 2018 by Gang Chen
Categories: Updates

Integration of historical map and aerial imagery to characterize long-term land-use change and landscape dynamics: An object-based analysis via Random Forests

A B S T R A C T

Tracking Earth’s past helps us to move from hindsight to foresight in seeking landscape sustainability, a pursuit aided by modern mapping capabilities but hindered by a dearth of historical landscape information. To fill the data gap and exemplify the use of old maps for land-use change sciences, we combined an old paper-based US civil war map and modern aerial photos to derive land-use history and landscape dynamics at fine scales for a region near Chancellorsville, USA, from 1867 to 2014. We also tested how advanced algorithms—object-based image analysis and Random Forests (RF)—could aid in data processing. Automatic classification of the scanned 1867 paper map proved difficult, but its manual digitization could benefit from object-based image segmentation. Classifying digital aerial images was more accurate via the object-based than pixel-based method, but only if the images were segmented appropriately. In the object-based classification, spectral-based features were much more important and useful than shape/geometry features for land-cover discrimination, as ranked by RF. During the 147 years, 32% of the region changed in land type. Settlement and roads increased in extent by 1850% and 691%, respectively, and woodland decreased by 19%. These changes fragmented the landscape, altered the hydrological regime, and affected river morphology. The utility of old maps exemplified here provides an impetus for leveraging extant old maps or historical records to support land-use and global change research. Our study also connotes the importance of preserving and geotagging current non-traditional data, such as photos, videos, and citizen science data, that can serve as a baseline to document future landscape change.

[Full paper]

New paper accepted by ISPRS Journal of Photogrammetry and Remote Sensing

July 10, 2018 by Gang Chen
Categories: Updates

Title: Stand age estimation of rubber (Hevea brasiliensis) plantations using an integrated pixel- and object-based tree growth model and annual Landsat time series

Abstract: Rubber (Hevea brasiliensis) plantations are a rapidly increasing source of land cover change in mainland Southeast Asia. Stand age of rubber plantations obtained at fine scales provides essential baseline data, informing the pace of industrial and smallholder agricultural activities in response to the changing global rubber markets, and local political and socioeconomic dynamics. In this study, we developed an integrated pixel- and object-based tree growth model using Landsat annual time series to estimate the age of rubber plantations in a 21,115 km2 tri-border region along the junction of China, Myanmar and Laos. We produced a rubber stand age map at 30 m resolution, with an accuracy of 87.00 % for identifying rubber plantations and an average error of 1.53 years in age estimation. The integration of pixel- and object-based image analysis showed superior performance in building NDVI yearly time series that reduced spectral noises from background soil and vegetation in open-canopy, young rubber stands. The model parameters remained relatively stable during model sensitivity analysis, resulting in accurate age estimation robust to outliers. Compared to the typically weak statistical relationship between single-date spectral signatures and rubber tree age, Landsat image time series analysis coupled with tree growth modeling presents a viable alternative for fine-scale age estimation of rubber plantations.


Fig. 1. Image-objects (yellow boundaries) capturing three stages of rubber tree growth, young (2005), middle-age (2010), and mature (2015). Three green grid cells represent pixels covering the same part of a rubber tree stand over years.

Yinan He completed his comprehensive exam

July 10, 2018 by Gang Chen
Categories: Updates

Yinan He, a PhD student at LRSERC, recently completed his PhD comprehensive exam. He is now a PhD candidate! Congratulations, Yinan!

Juan Geng successfully completed her MA defense

July 10, 2018 by Gang Chen
Categories: Updates

Juan Geng, an MA student at LRSEC, successfully defended her thesis in May 2018. Juan will start working at a remote sensing and precision agriculture company in California this summer. Big congratulations!

Juan Geng presented at AAG

April 20, 2018 by Gang Chen
Categories: Updates

Juan Geng, MA student in the lab, successfully presented her research at AAG in New Orleans. Great work, Juan!

Presentation topic: Reconstruction of cloud-contaminated NDVI time-series for high-resolution deforestation monitoring in the tropics

Special issue editorial published

February 11, 2018 by Gang Chen
Categories: Updates

An editorial preface was published in GIScience & Remote Sensing for a special issue about GEOBIA.

Chen, G., Q. Weng (2018). Special issue: Remote sensing of our changing landscapes with Geographic Object-based Image Analysis (GEOBIA). GIScience & Remote Sensing. https://doi.org/10.1080/15481603.2018.1436953.

« Older Posts
Newer Posts »
Copyright © 2012-2025 Gang Chen, University of North Carolina at Charlotte. All rights reserved.
Skip to toolbar
  • Log In