Whereas the global warming app I mentioned is based on analysis of data we already have, the future projections of the impacts of global warmings are ridiculously interesting, speculative, and terrifying at the same time. Hurricane Sandy and some of the stories that emerged from the storm surge – including the story of a building in Brooklyn that happened to be building where a storm surge swept through but was undamaged because the the contractors were building with the knowledge that sea level rise will dramatically affect even NYC (building for the future added $550k to the $100 million budget, says the article) and including a very informative interview with a well-known and respected NASA scientist at NOAA’s relatively new Climate Service website – showed that sea level rise is very much on the mind of many. Yet another great webapp published by the New Scientist shows two examples of SLR and how the non-uniform the impacts are expected to be. This is a projection into the future, but many recent studies, like this one based on tide gauge data, agree with non-uniformity in SLR. A great snippet from that Nature Climate Change publication (which was subject to peer-review before publication) is this one 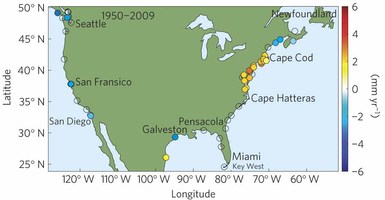 , which shows clearly that the West Coast and East Coast of the USA have already experienced much different responses to SLR. The data seems to be in line with the models, where a model projection is what is shown in the webapp. Another great visualization!
Resources to understand sea level rise
Categories: Earth System Observer