The latest reported value from 4th of May 2013 was 399.68 ppm. That’s as close to 400 ppm as we (our civilization and planet, that is) have gotten. The best place to see the rapidly updated CO2 concentrations is at the Scripps/UCSD website – the curve seen at the link is of course the famous Keeling curve, named after the scientist (Charles Keeling) who began the systematic monitoring of CO2 gas concentrations in our atmosphere back in the late 1950s. CO2 is measured at sites all around the world (choose a site from the map, then click on Carbon Cycle Gases, Time Series, Submit to see CO2), but the remote ocean sites like Mauna Loa, Hawaii provide the background concentration. This means that the concentration represents the average concentration around the world, as opposed to putting the instrument that measures CO2 concentration right next to a power plant or a fire or some other direct source of CO2. Once CO2 is emitted from a source, it mixes throughout the atmosphere fairly evenly because the molecule has a long (100-1000 year) chemical lifetime before it is drawn out of the atmosphere and into the oceans, forests, or rocks. This long life in the atmosphere means that CO2 accumulates in the atmosphere. The Northern Hemisphere has a slightly higher CO2 concentration than the Southern Hemisphere because there are more CO2 emission sources in the north (more human activity) and because mixing across the Northern and Southern Hemispheres is relatively slow – it takes about a year for a gas molecule to float across the equator, as shown in the figure to the right from Daniel Jacob’s atmospheric chemistry textbook.
 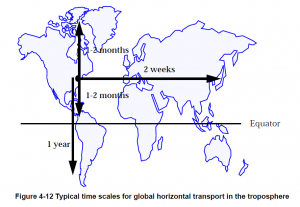 You can also see in the figure that it takes much less time to mix East-West and to the North for a molecule emitted in the Northern Hemisphere. Go to the link at NOAA Earth System Research Lab (ESRL) to see this mixing/emission effect play out. I chose to compare Mauna Loa in the remote Pacific and Crozet Island which is southeast of Africa in the even more remote southern ocean. Crozet Island is well behind Mauna Loa in data processing but we can compare July 2012 CO2 concentrations, which are about 396 ppm at Mauna Loa and 391 ppm at Crozet Island.
Getting back to the 400 ppm, we can expect this value to be drawn down as the biosphere – plants – breathe in the CO2 during the summer growth period. This happens every year, but our fossil fuel emissions are overwhelming that breathing cycle. Science always boils down to context, and in this part of the global warming problem, the context is simple. CO2 concentrations are much higher than anything ever seen in since human civilization emerged. Note the time scales on the graphs below are the past 300 years and past 800,000 years. As many times as I have seen different versions of these figures, I still am in utter shock at how much we’ve altered the chemical composition of our planet’s thin atmosphere. 
