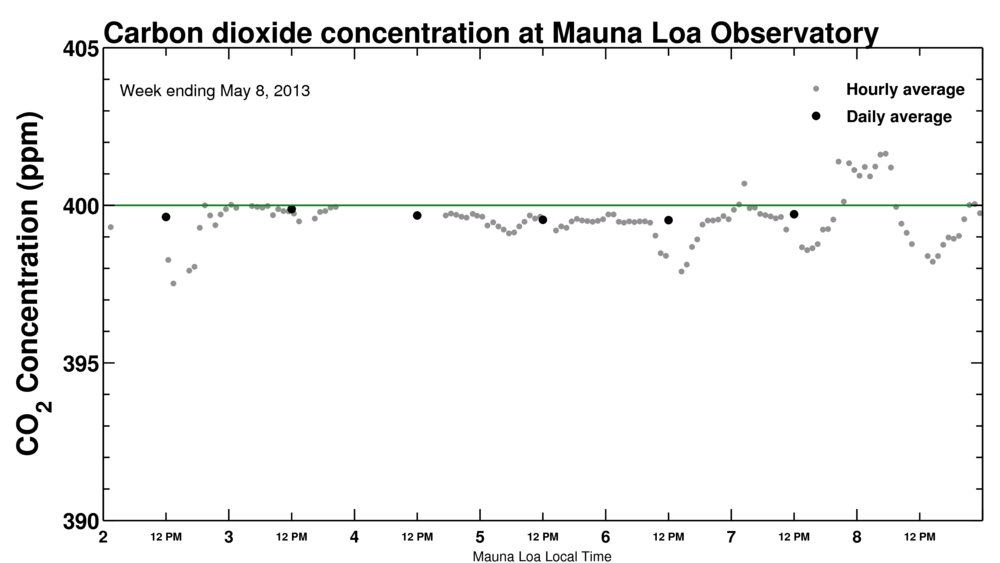
An update from the measurements being reported from Scripps that I discussed earlier. Here’s the screen shot when I checked the “box scores” for our favorite greenhouse gas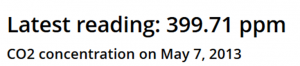 whew! I know if I patiently wait, the CO2 concentration will rise above 400 ppm in earnest since CO2 concentrations have been increasing by about 2 ppm/year
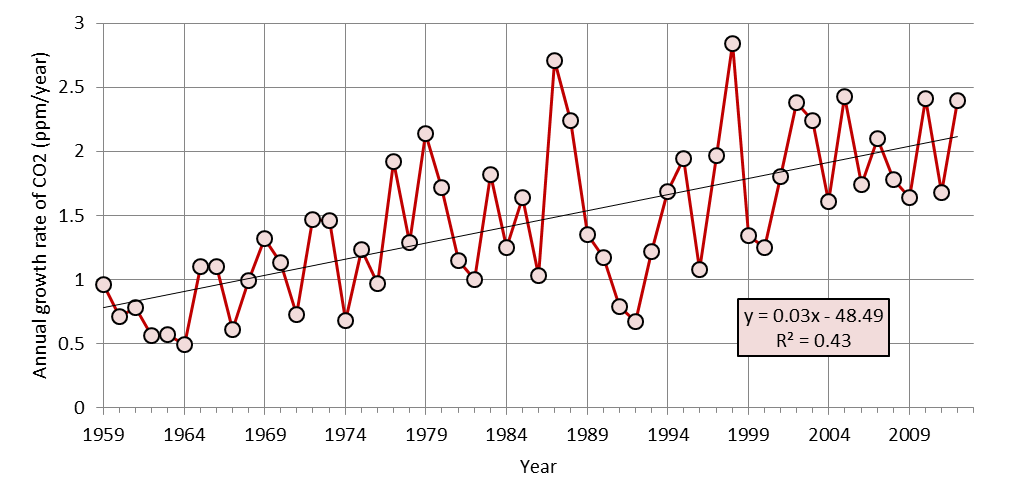
Global growth rate of atmospheric concentration of CO2 from 1959 to 2012 (data from NOAA ESRL in link below). 1959 is the start of in situ measurements. The best-fit line is overlaid for reference. You can see that the correlation coefficient is high. In this case, the R2 = 0.43 means that a line captures about 43% of the variance in the annual data. That, in turn, means that a line is a good approximation for predicting where we are going in the near-future.