An update to my update from the original post. CO2 is rising 2 ppm/year and has been for about the last decade (see graph here). So the daily ups and downs and pretty miniscule. 2 ppm/year is 0.0055 ppm/day, or thought of yet another way – it’ll take about 180 days for CO2 to increase 1 ppm. While we await the inevitable, here’s an update with May 13 at least above 400 ppm, although the measurements are pretty variable for some reason.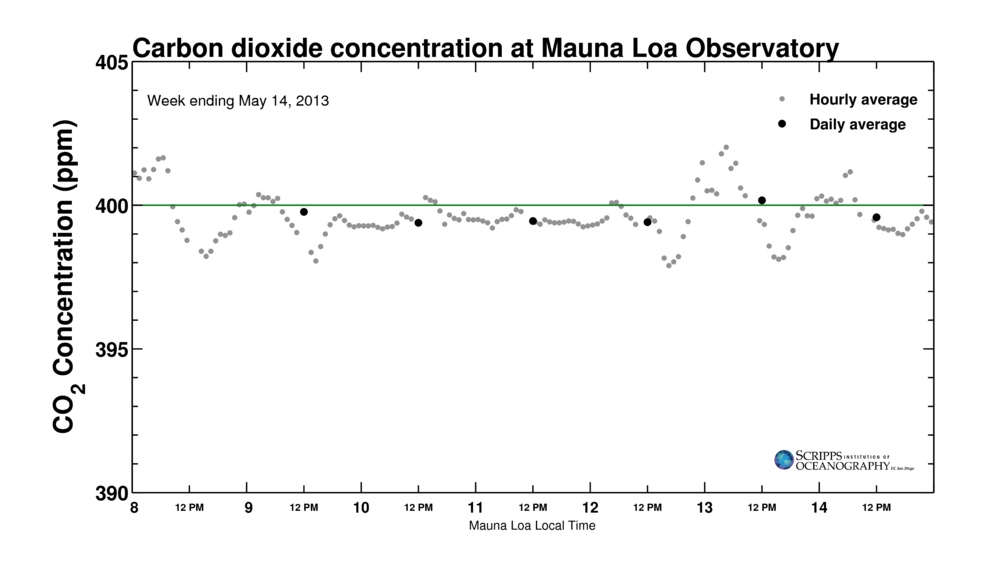 Variability in CO2 during the course of any one day can be for a number of reasons. One that scientists responsible for quality-control of the data have to account for is the simple fact that Mauna Loa is a gigantic shield volcano
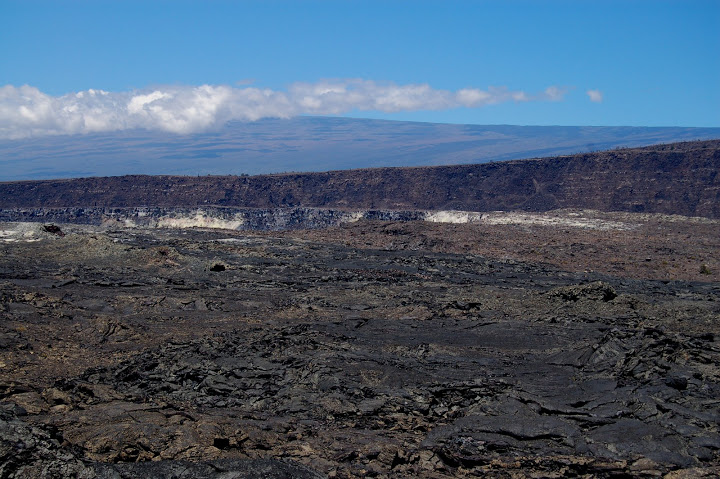
Photo taken by me from the Kilauea Caldera in 2007. Mauna Loa (13000 ft elevation) looms in the background under a shroud of clouds, but it’s shocking how small that 13000 ft mountain looks.