The whole month has been an edge-of-your-seat wait-and-see when CO2 will stop hovering above and below 400 ppm and just stay above. Unlike Miguel Cabrera‘s triple crown of 2012 or the thoughts that he could repeat that feat in 2013 or even be the first since Ted Williams to hold a 400 batting average (can he do it – this evidence says yes), the increase in CO2 above 400 ppm is inevitable. Inevitability means you just need patience. Patience for me means more time to think about the numbers.
CO2 data are available from a number of sites
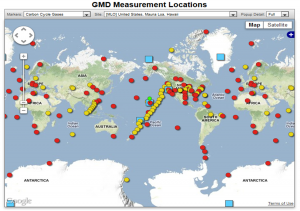
Sites around the world that are monitoring CO2 and other gases in the atmosphere.
According to the twitter feed, daily-averaged CO2 exceeded 400 ppm on May 13 with CO2 of 400.16 ppm. By my own calculations using the daily tweets, weekly-averaged CO2 exceeded 400 ppm for the first time in the week ending May 19 (CO2 was 400.01 ppm). The next milestone is when the monthly-averaged CO2 exceeds 400 ppm, and then annually-averaged, and so on. We are approaching what should be the peak CO2 this calendar year as the growing season begins and CO2 is drawn down from plants breathing in CO2. Eventually, the Earth will be perpetually impacted by more than 400 ppm CO2 and even the seasonal drawdown in CO2 of 5-6 ppm from May to October every single year as plants in the biosphere convert CO2 into oxygen via photosynthesis will not overcome the long-term trend in CO2. The CO2 will remain in our atmosphere for 100s-1000s of years. The Earth will slowly re-equilibriate to this elevated CO2 through a myriad of processes that include ocean uptake, plant growth, chemical weathering, and finally increased surface and lower atmospheric (tropospheric) temperatures due to the absorptive power of CO2 in the infrared part of the electromagnetic spectrum. The impacts of increased CO2 and other atmospheric components that can force climate into a new state are the main reason climate science remains active. In a post that will be ready as soon as the data is available (June 2), I’ll show the weekly-averaged CO2 trend in the month of May based on the Keeling Curve twitter feed. In other words, I’ll show inevitability.