The month of May is officially over, and perhaps the Earth is about to take a big breath in and begin to draw down CO2 from its year 2013 peak. The last tweets by @Keeling_curve showed a relatively (emphasis on relatively!) sharp decrease from May 29 to May 30 with CO2 falling from 400.33 ppm to 398.41 ppm, and then May 31 had variability that was too high as tweeted here. Funny side note was that for whatever reason, this “data too variable” drew the attention of one well-known (but not well-respected) blog, to which @Keeling_curve replied “see here“. Geez, you’d think seasoned bloggers would click a couple of web links before tweeting a question like that. The values of CO2 should start their annual decrease from the peak value in the Northern Hemisphere as the plant life in temperate and polar zones comes to life, but in the mean time, we’re living in the age of a 400 ppm CO2 world, which is very unusual in recent geological history, as discussed here and shown here. Here’s the time line of CO2 concentrations for this historic May 2013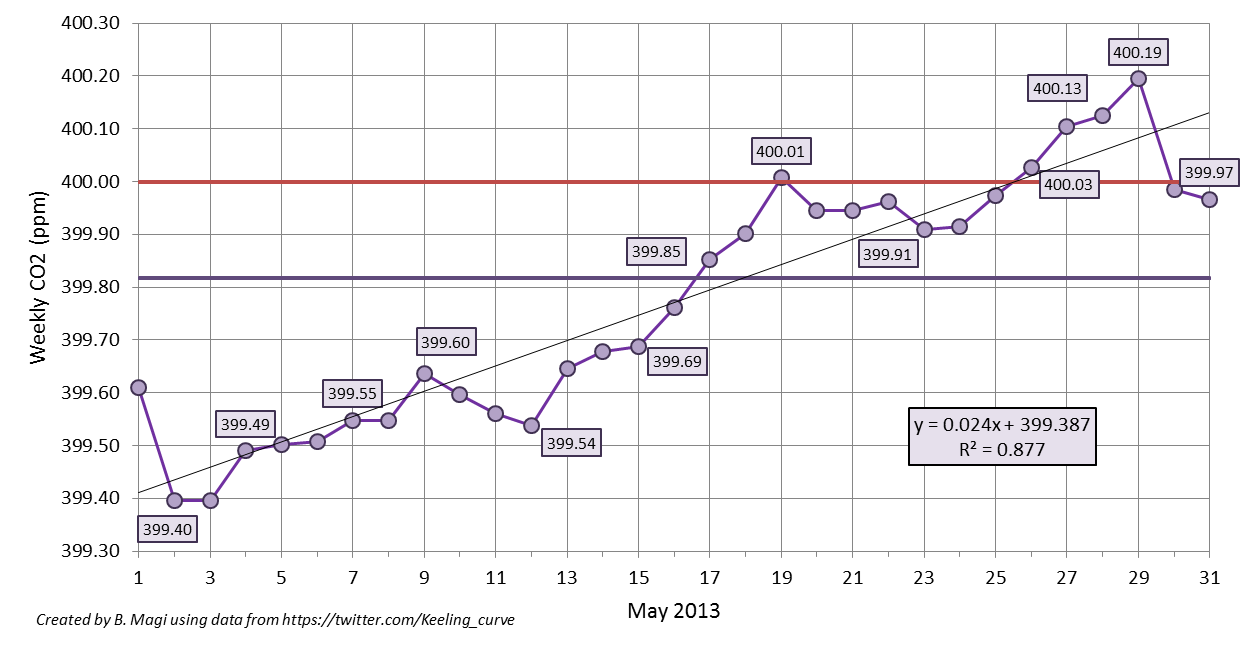 which shows the weekly-averaged CO2 from the daily-averaged values posted on Twitter (ok, tweeted). The straight horizontal purple line is the monthly-averaged CO2 of 399.82 ppm (wow!), and the straight red line is the mystical 400 ppm CO2. I calculated the weekly-average as the value of the previous 7 days up. For example, May 15 weekly-average is the average of values from May 9 through May 15. The weekly-average ideally is 7 data points, but occasionally a daily-averaged value is not tweeted due to high variability in the data. From the figure you can see that we reached our first weekly-averaged CO2 concentration greater than 400 ppm on May 19. I actually thought that would be it for the year, but from May 24 to May 29, daily values were again well over 400 ppm. This brought the number of weekly-averaged values greater than 400 ppm up to 5. Roughly, about 33% of the days in May 2013 had CO2 greater than 400 ppm. The decline should begin soon with the annual minimum in September-October reaching values of about 394-395 ppm, noting that the annual minimum for 2013 will probably be very close to the maximum from only 2 years ago. Below is the data shown in the graph above. An impressive May, and one that will be recorded in the history books.
                       carbon dioxide (ppm)
year    month   day     daily   weekly
2013	5	1	*	399.61
2013	5	2	399.29	399.40
2013	5	3	*	399.40
2013	5	4	399.68	399.49
2013	5	5	399.54	399.50
2013	5	6	399.52	399.51
2013	5	7	399.71	399.55
2013	5	8	*	399.55
2013	5	9	399.73	399.64
2013	5	10	399.4	399.60
2013	5	11	399.46	399.56
2013	5	12	399.41	399.54
2013	5	13	400.16	399.65
2013	5	14	399.91	399.68
2013	5	15	399.74	399.69
2013	5	16	400.25	399.76
2013	5	17	400.04	399.85
2013	5	18	399.8	399.90
2013	5	19	400.15	400.01
2013	5	20	399.73	399.95
2013	5	21	399.91	399.95
2013	5	22	399.85	399.96
2013	5	23	399.88	399.91
2013	5	24	400.09	399.92
2013	5	25	400.2	399.97
2013	5	26	400.53	400.03
2013	5	27	400.27	400.10
2013	5	28	400.06	400.13
2013	5	29	400.33	400.19
2013	5	30	398.41	399.98
2013	5	31	*	399.97
*data was too variable over the course of the day. no value was reported on twitter.