
As I browsed through my favorite twitter feeds which includes @BeijingAir and the other US Embassies, I saw there was some really really poor air quality in Beijing. The US Embassies in China tweet particulate matter 2.5 (PM2.5) concentrations in the atmosphere on an hourly basis and also provide 24 hour average PM2.5 per the (USA) EPA regulatory methods. Namely, 24 hour PM2.5 is what’s regulated by the EPA in our country, and since US Embassies are US territory (as I understand it from The Simpsons Bart vs Australia episode), then US-relevant metrics are tweeted in addition to the hourly data. I tweeted about the very poor air quality in Beijing today
#BeijingAir 6-28-13 19:00 1hour PM2.5 is 466 ug/m3!! On #EPA AQI scale, that is 477 or "Hazardous" for a 24 hr exposure. that is really bad.
— Brian Magi (@brianmagi) June 28, 2013
and
Holy cow. 24 hour PM2.5 #BeijingAir is 294.5 ug/m3 or 345 AQI or Hazardous! 500 AQI is as bad as #EPA goes. Please cease all breathing now.
— Brian Magi (@brianmagi) June 28, 2013
The second tweet was an tribute to an Onion article saying something like EPA tells people to stop breathing but I couldn’t find a link. Ok. So after I sent out that 2nd tweet, I began to wonder: What the heck is going on in Beijing? PM2.5 is above 400 ug/m3* for hours on end during the day and the 24 hour average PM2.5 just got tweeted as nearly 300 ug/m3. This is extremely hazardous, both on the EPA scale of Air Quality Index (AQI) and on the scale of I-Cannot-Breathe-Long-Enough-To-Finish-This-Sente… (no link to that scale). As the title of the post implies, the answer is related to burning practices – and I think it’s worth more that a couple of tweets. I’m asserting that the main problem is emissions from local/regional agricultural fires. This touches on my own research into fires and the peculiar human-influenced fire seasonality as a function of where you are in the world. Now, take it easy, I tell myself. Why? Every scientist loves to talk about science, but we especially love talking about our own research. I’ll try not to go on and on, is what I’m saying.
How can we do a first-order (read as “informal”) test of this hypothesis? First, let’s check satellites. There is some very accessible information from NASA that can be used to study problems that aren’t in the data-rich part of the world or in the parts of the world where I don’t even know what the characters are for “fire”. NASA has a satellite called Terra reporting data since November 2000. From this page, I googled the lat-lon of Beijing (40 N, 116 E) and created my own custom satellite image of Eastern China with the approximate location of Beijing marked.
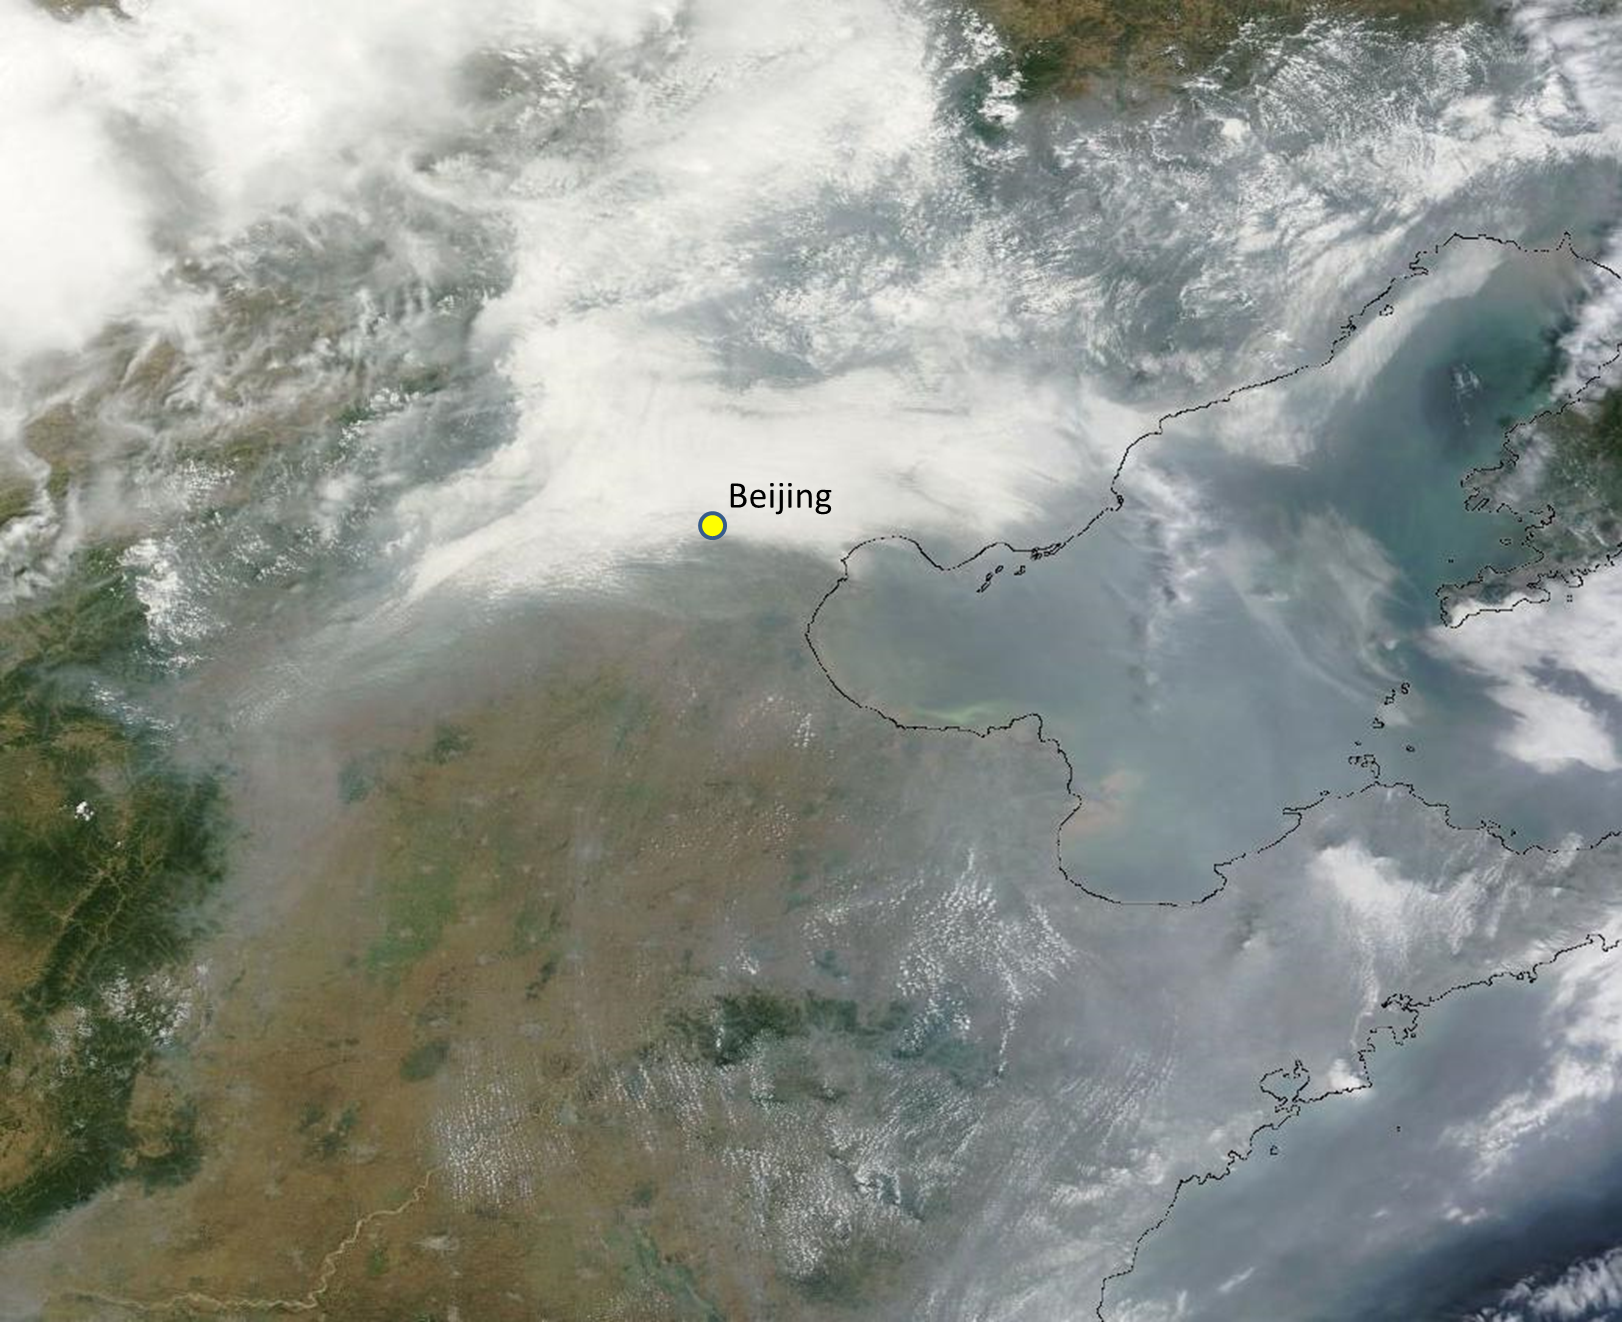
Satellite image from MODIS sensor on the NASA Terra satellite for June 28 2013. Beijing location is approximate.
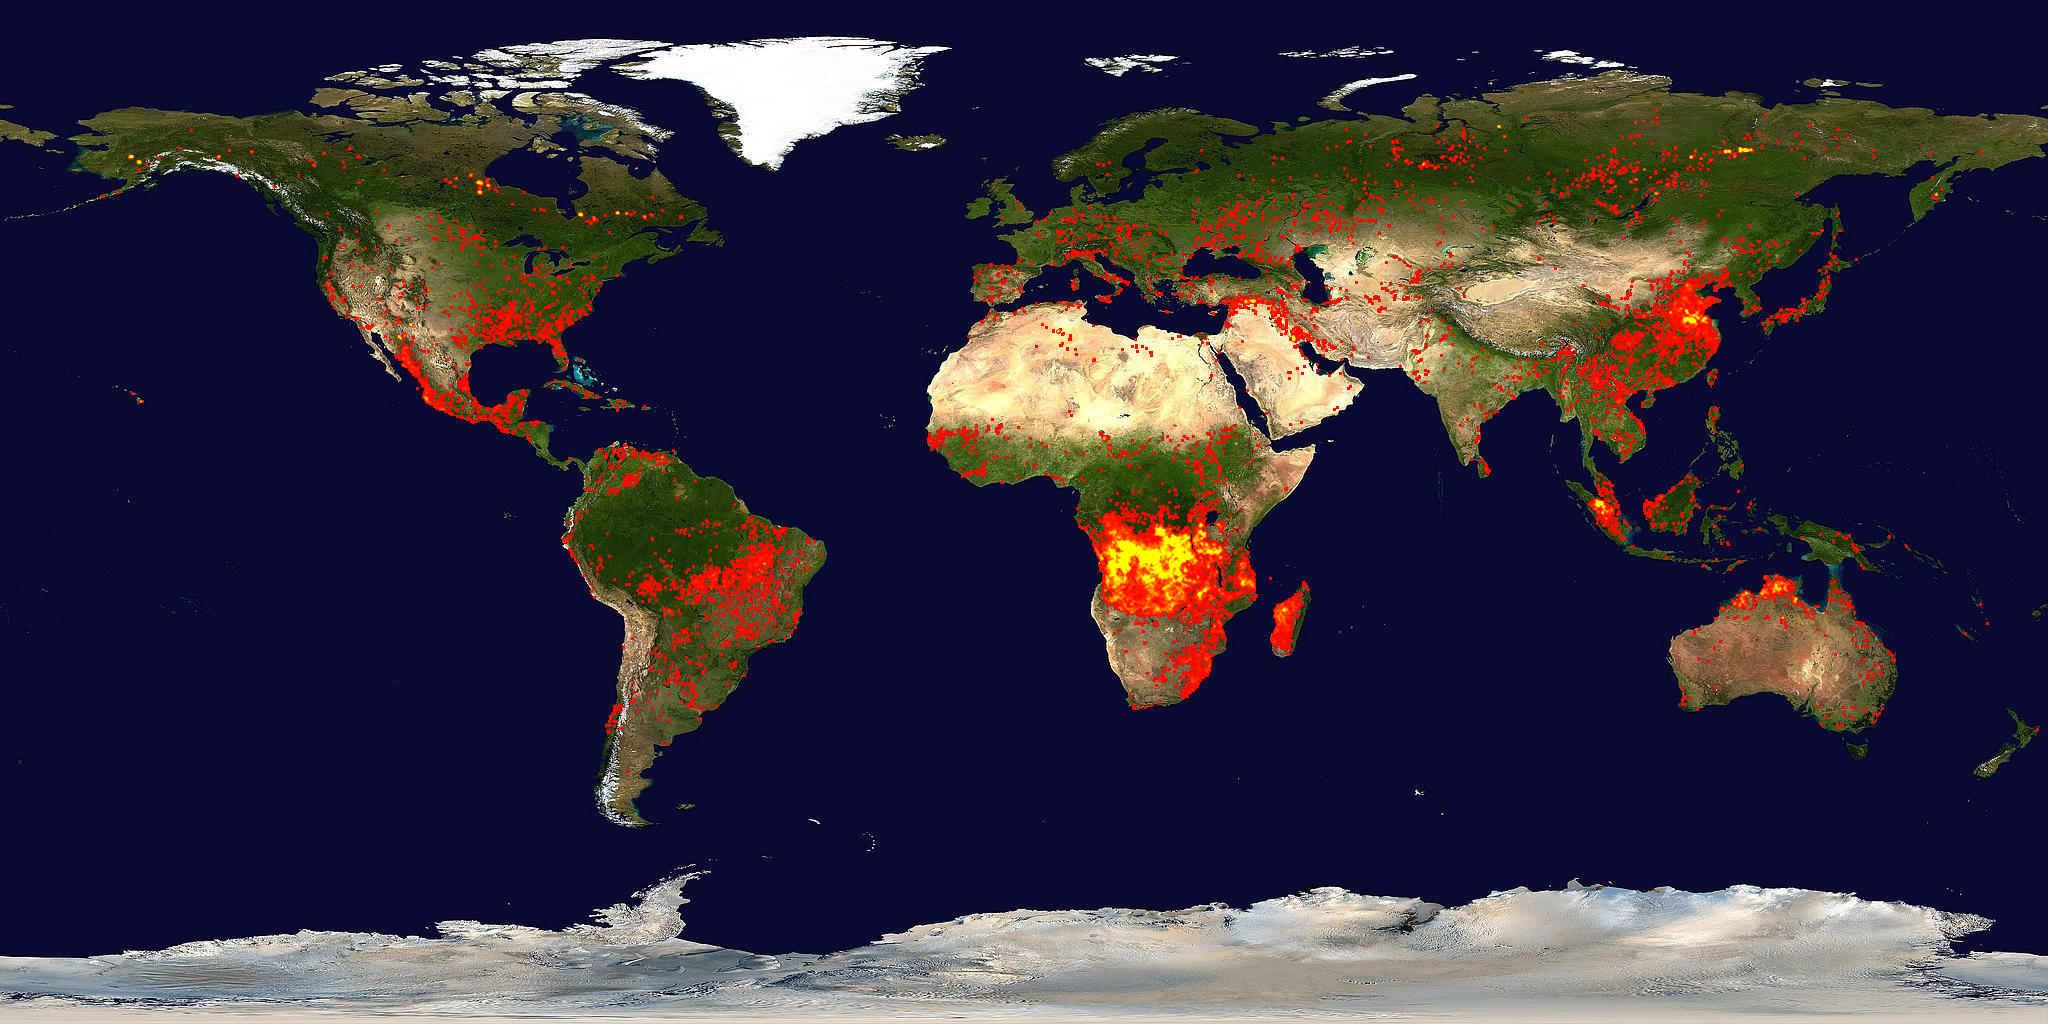
Global fire activity from the last 10 days ending on June 28 2013.

Active fires from the MODIS sensor on the NASA Terra for the 48 hours ending on June 28 2013.
The winter and spring months – the months related to the very poor air quality referred to in the report above and here – are plagued by deep near surface temperature inversions that act to inhibit mixing. What does this mean? Well, if pollution is emitted from cars and factories in Beijing in the winter-spring, it will tend to stay in the first 500 meters (1800 ft) above the ground – roughly. The pollution gets trapped. On a day without a temperature inversion, the pollutants emitted are probably about the same, but mix into a much deeper atmosphere (say about 2000-3000 meters, or about 4-6 times deeper layer). The pollution is thus more dilute. I haven’t checked meteorology in the case of todays very poor air quality, but I suspect the effect of meteorology (even if mixing is deep and efficient) is overwhelmed by the emissions from all the fires southeast of Beijing.
What kind of fires? Or why are they burning? Great question! Are these forest fires like the lightning-triggered fires plaguing the Western USA right now? No! When you mask out the Terra MODIS fire data in a way that you only look at data from land that is mostly cropland (agriculture) in Eastern China, then you find something related to our findings in the Biogeosciences paper.
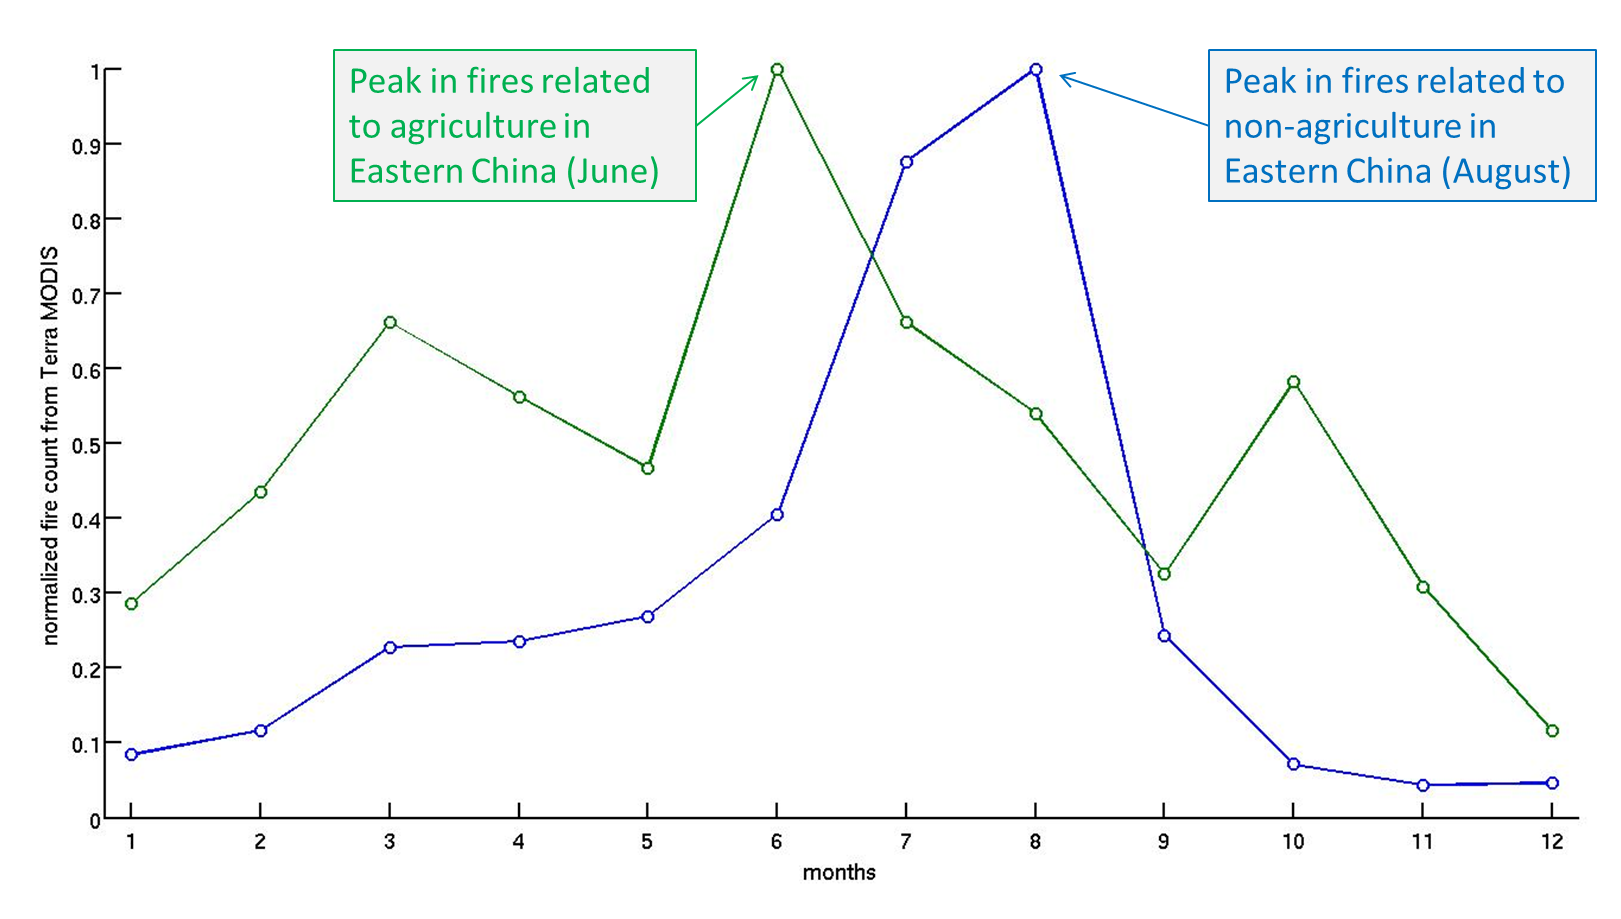
Fire season for land that is mostly agriculture (cropland in Eastern China) and land that is mostly non-agriculture (forests, grasslands). This is based on the average over 10 years of data from MODIS. The region considered is roughly Mongolia and China. Other parts of the world look much different – more analysis like this in the link to my paper below.
The figure above shows that while the land with a low fraction of cropland (less than 20%) tends to burn in July-August, the land with a high fraction of cropland (greater than 80%) tends to burn in (you guessed it) June-July. As the caption states, these “average” seasonalities are based on over 10 years of Terra MODIS fire observations. When you average 10+ years of Junes for the low and high fraction of cropland, you get the data point in month six for blue and green curves above. In other words, the fires are right on schedule, Eastern China! Hopefully for the citizens of Beijing, the burning will be short-lived and meteorology will transport the smoke away and dilute it down with clean air in the process.
All that being said, a full scientific analysis of the air quality requires much more than this post offers. Sensitivity, ground-based analysis, meteorological analysis, and actual counting of the fires among other things would be required to prove with a much higher degree of confidence that my hypothesis does not fail, but usually scientists make hypotheses because they observe an event/phenomenon that is consistent or inconsistent within some sort of framework. In this case, what I saw in China air quality was inconsistent with what I understood about the meteorology there (for this time of year) and consistent with the work I did with colleagues regarding fire seasonality.


