AGU session to explore drivers of fire

I’m excited to be hosting an American Geophysical Union (AGU) session in December 2017 and excited about only having to fly to New Orleans instead of San Francisco. This is the first time in many many years that AGU has not been in San Fran. My session co-conveners are Sam Rabin (Germany), Fang Li (Beijing), and Guido van der Werf (Netherlands). Alex Schaefer (my PhD student) will certainly be out there, and I hope our session hosts a diverse set of oral and poster presentations that allow us all to collectively explore the many different scales of how to study fire patterns on our planet, and what it all means in the context of the on-going human-driven climate change. The session viewer link for AGU is at https://agu.confex.com/agu/fm17/preliminaryview.cgi/Session26024 and here are the details:

Session Title: Quantifying drivers of global and regional fire patterns using data and models

Session ID#: 26024

Session Description: Fire is a critical component of Earth system dynamics and the carbon cycle. However, since climate and human driving factors vary considerably over time and space, capturing observed patterns using simulations remains a major challenge. These challenges also result in important uncertainties in predicting future fire activity, understanding past fire activity, and quantifying the role of fire in the Earth system. Paleorecords offer a diverse source of global/regional fire data on decadal to millennial timescales. The present day has extensive satellite records and increasingly detailed observations. Fire model are informed by present day records, but offer a way to test fundamental hypotheses well beyond the present. This session seeks presentations that aim to quantify the role of humans and climate in driving patterns of fire at multiple spatiotemporal scales. The goal of our session is to foster interdisciplinary discussions of how data can inform models, and models can inform data.

Primary Convener: Brian Indrek Magi, University of North Carolina at Charlotte, Charlotte, NC, United States
Conveners: Sam S Rabin, Karlsruhe Institute of Technology, Karlsruhe, Germany, Fang Li, Inst. of Atmospheric Physics, Beijing, China and Guido van der Werf, Organization Not Listed, Washington, DC, United States

Cross-Listed: A – Atmospheric Sciences, GC – Global Environmental Change, NH – Natural Hazards

Index Terms: 0414 Biogeochemical cycles, processes, and modeling [BIOGEOSCIENCES], 0434 Data sets [BIOGEOSCIENCES], 0466 Modeling [BIOGEOSCIENCES], 1630 Impacts of global change [GLOBAL CHANGE]

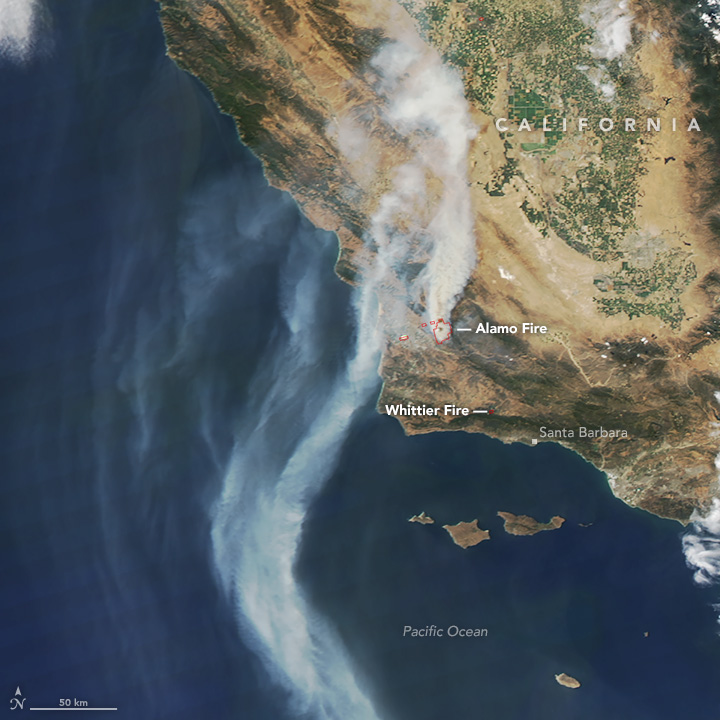
Fires in California during Summer 2017

Posted in Group News | Tagged , , , , | Comments Off on AGU session to explore drivers of fire

Unusually Bad Air Quality in North Carolina

Many communities in western North Carolina and in the Queen City of Charlotte have been and continue to be impacted by smoke pollution from fires on the eastern side of the Appalachian Mountains near Lake Lure and South Mountain State Park. The smoke is moving through the near-surface atmosphere with the wind and being trapped

Image from the NASA MODIS sensor tweeted out by Brad Panovich at https://twitter.com/wxbrad/status/798969527417634823

Image from the NASA MODIS sensor tweeted out by Brad Panovich at https://twitter.com/wxbrad/status/798969527417634823

near the surface by a cold layer of air that forms overnight under what is called a surface temperature inversion. The inversion means that colder, denser air resides below warmer air, and because this is a relatively stable situation, the inversion traps any surface pollution near the surface. This is bad for people, since the surface is the part of the atmosphere we all live in, but the pollution event presents a very unique opportunity to collect data. Unique data is always interesting to scientists.

Earlier this calendar year, I worked as a part of an art-data-science initiative called Keeping Watch on Air, which was a big team of people from UNC Charlotte and Clean Air Carolina to work on how we talk about Air Quality in the Queen City. Clean Air Carolina spearheaded the Particle Falls art-science exhibition, which I hope everyone saw – it was amazing. Keeping Watch was/is a grassroots effort (no one gets paid) to bring broad expertise, stakeholders, and other agents together on a problem we all agree is important. One part of that project was an effort to figure out how to think about the air quality data scientists like me try to understand. Usually this kind of data is presented in “micrograms per cubic meter” or as an index called the Air Quality Index. I was working with Alisa Wickliff at the UNC Charlotte Center for STEM Education and a group of K-8 Teachers and Students on a science project where they collected air quality data, and I analyzed/processed it. Perfect for everyone! Crista Cammaroto (College of Arts and Architecture, Director of the Projective Eye Gallery at UNC Charlotte Center City) and I thought up a way to talk about Keeping Watch data that was in terms of something we all think about with air pollution: Particles per breath. We wanted to give people a sense of how much your body deals with in every breath, and what it looks like for polluted conditions. The posters Crista and I put together using the school data, my particles per breath calculation, and her eye for visual display are below. The dots show how many particles per breath and the imagery is from the students at the school to remind everyone why we should care about this stuff.

keeping-watch-sampleSo I applied our Keeping Watch on Air methods/thinking to the air quality data from today. Here’s what I found.

2016-11-16-09local-charmeckaq
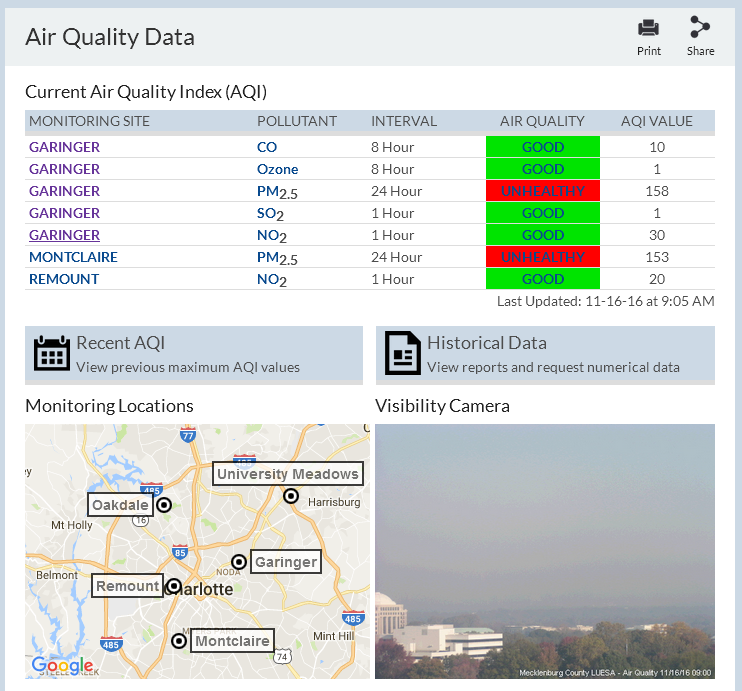
This morning, Charlotte/Mecklenburg was in Code Red air quality, which is an unusually high value of AQI that we have not experienced in the last five years at least (thankfully!). Our AQI was 158 this morning from Garinger High School, which is managed by our county air quality office so they can report official numbers to the Environmental Protection Agency (EPA) and they can check our county against the national standards for pollution that have been established by science. The 158 AQI is determined from the average PM2.5 over the past 24 hours. Within that 24 hour period, there was a morning peak of AQI of 188 when I looked at the NC Division of Air Quality data. When I convert the 158 AQI to particles per breath via the methods I used for Keeping Watch on Air, then I found that we were breathing about 1000 particles per breath over the past 24 hours. The background “typical” PM2.5 concentration in Mecklenburg is much lower – around 100-200 particles per breath. So the air we were breathing today had about 10 times as many particles in every breath we took! And it was even higher – around 1700 particles per breath – during the peak of the pollution.

For comparison, I tweeted about how our air quality compared with the super-polluted megacity of Beijing, which is home to more than 10 million people. Our State Department USA embassy in Beijing has a high-quality air monitor system there and sends out automated tweets https://twitter.com/BeijingAir which is what i looked at to build a comparison. Their 24 hour avereage PM2.5 from about the same day as Queen City’s air pollution showed PM2.5 AQI of 180, which I translated into about 1500 particles per breath. Essentially, for this kind of quick “back of the envelope” type of calculation, our air quality and Beijing’s air quality were about the same. Said another way, if you felt discomfort or worse in today’s air quality, imagine living in Beijing or another mega-city without the policies that regulate pollution for us to actually have clean air.

2016-11-16-comparison-name
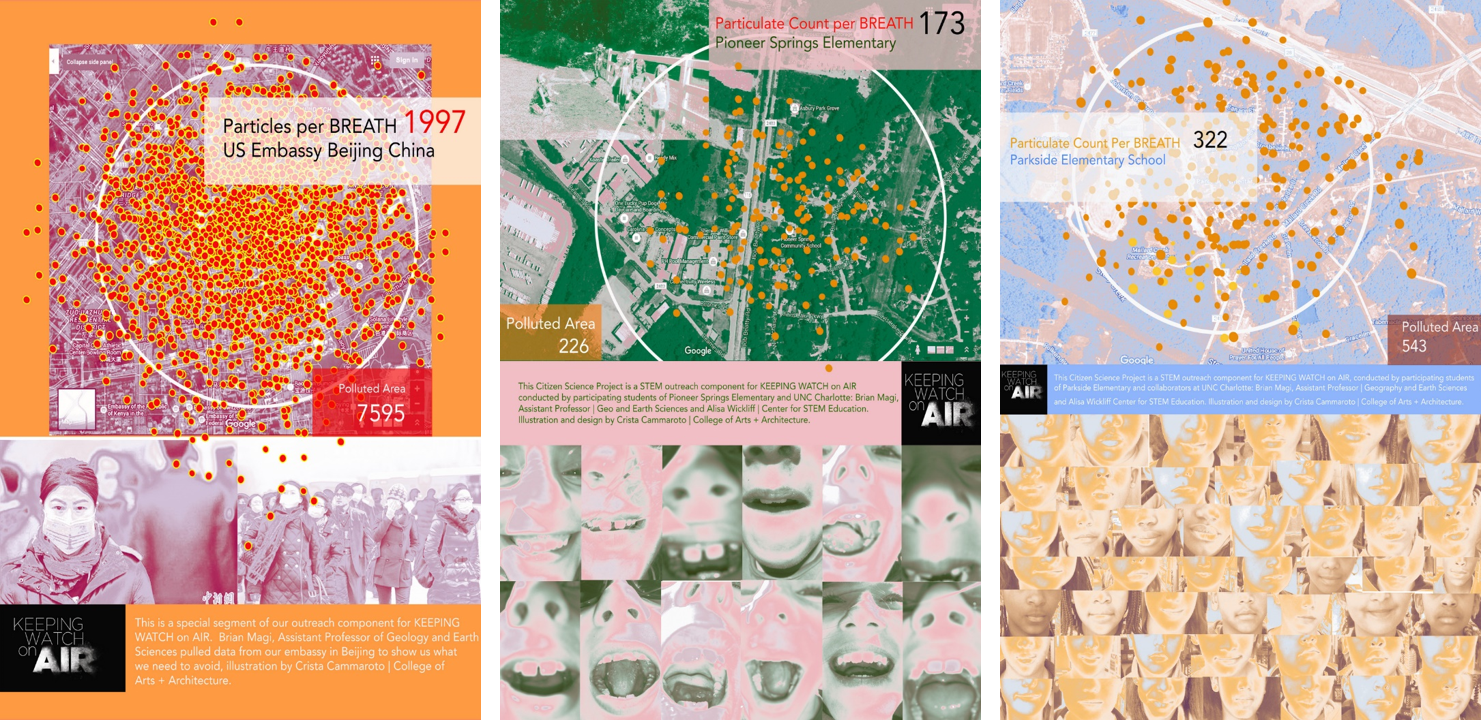
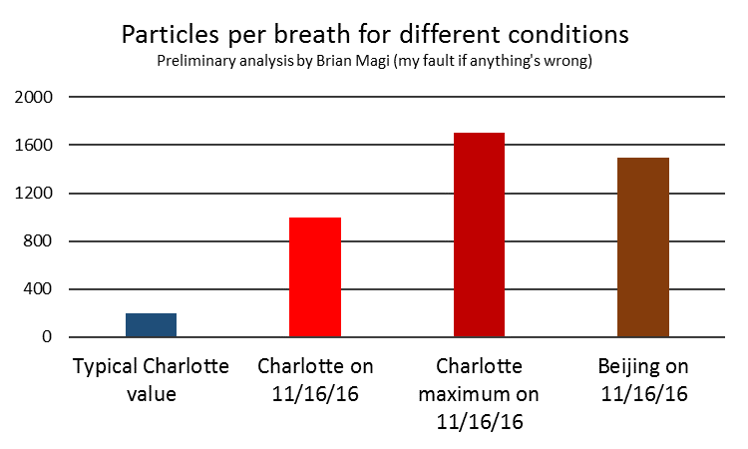
Bottom line, for much of the day we were breathing more than 10 times as many particles in every breath than usual. This is like a semi-typical day in Beijing where 50% of the days have AQI greater than 169 according to this peer-reviewed analysis by atmospheric chemists. I am working with staff at Clean Air Carolina and at least one UNC Charlotte student (Calvin Cupini) on analyzing data we collected around this pollution event, but results are TBD. It’s rare to have super high air pollution here, so as scientists we try to learn about what this means. As a fellow citizen of Mecklenburg, I do worry about what even a few days of high pollution means for all of our neighbors, and especially kids. For now, try to enjoy more colorful sunsets while the Queen City is impacted by all the smoky gunk in the atmosphere, and breathe deep when this pollution event subsides.
smoky-sunset-mark-barber-wsoc9

Posted in Research News | Tagged , , , | Comments Off on Unusually Bad Air Quality in North Carolina

Pyrogeography at the AAG Conference

Another major conference is on the horizon – the Association of American Geographers (AAG) meeting which is in Chicago this year. Check #AAG15. Conferences are absolutely critical for multidisciplinary/interdisciplinary research, and I think for just about all research. Science, like many (most?) other professional enterprises, requires discussion. My first AAG was last year in Tampa, and that was a great experience. The atmosphere at the Tampa conference was informal, yet had the intensity associated with presenting a range of results from preliminary to pretty polished to peer-reviewed and published results. I also liked the thematic message from AAG 2014: Research about climate change past, present, and future will benefit from geographical thinking.

Annual firecounts from the NASA MODIS sensor on the Terra satellite.  Nearly 2 million fires happen every year!

Annual firecounts from the NASA MODIS sensor on the Terra satellite. Nearly 2 million fires happen every year!

Geographical thinking, to me, implies a consideration of human-environmental interactions across multiple spatial and temporal scales. Atmospheric sciences, which is my “home” discipline, tends to focus on atmospheric interactions across time and space scales. Fire research has to consider human-climate-fire interactions, and while I tend toward the climate-fire side since it’s closer to my home discipline, I keep hoping to see some new patterns that capture some regularity in human behavior in the world of large-scale global fire activity. Fire is important in understanding past and future carbon cycle dynamics, but also seems to be symbolic of the human impact on our planet. Are humans driving fire? Are they agents that change fire regimes and then in turn respond to the changing regime? Or is climate exerting a longer time scale control on fire activity that is above and beyond human control? Many interesting questions emerge from questions about fire drivers at seemingly every spatiotemporal scale, and throughout disciplines that could be aligned with geography.

AAG 2015 will include a full day talks about fire on our planet, or pyrogeography. I think pyrogeography is a great term that encapsulates my research. So Earth Day 2015 for me will be at the AAG Pyrogeography Session. I worked with several different types of researchers studying pyrogeography to bring data, modeling, and cultural expertise together for what is now 25 talks on Wednesday April 22. 8am to 7pm.

Pyrogeography Sessions at AAG
8:00 AM – 9:40 AM 2101 Pyrogeography I: Fire Histories 1
10:00 AM – 11:40 AM 2201 Pyrogeography II: Fire Histories 2
11:40 AM – 1:20 PM Lunch
1:20 PM – 3:00 PM 2401 Pyrogeography III: Fire Drivers
3:20 PM – 5:00 PM 2501 Pyrogeography IV: Fire Case Studies
5:20 PM – 7:00 PM 2601 Pyrogeography V: West African Fires

My talk will focus on how global fire modeling – a framework to simulate the biogeophysical processes driving fire activity – contributes to the discussion, and how it can advance the discussion so that we can better test hypotheses about human-climate-fire interactions. I’ve been closely reviewing some recent (peer-reviewed, published) work by scientists working on fire modeling to prepare for my talk. One of my current favorite visualizations of how human activities introduce big challenges in fire modeling is from a paper by Pfeiffer, Spessa, and Kaplan that shows that the biggest discrepancies between complex fire modeling and satellite data (like above) are in parts of the world most impacted by humans.

Lighter colors indicate that regions with larger discrepancies from observations are in areas impacted most by humans.  Are humans agents in fire patterns?  Are they responsive?

Lighter colors indicate that regions with larger discrepancies from observations are in areas impacted most by humans.

My colleague, Sam Rabin, will present work we’ve been finalizing over the last 3 months to better understand how satellite data can be used to unpack fire signals into component parts such as cropland and pasture fires. Our research has a lot of interesting implications about how widespread/important pasture fires might be. Not coincidentally, pasture and cropland maps like the one below from our 2012 paper, show that human impact and cultivated land are similar. There is 148 million square kilometers of land on Earth, 100 million square kilometers is vegetated, and 50 million square kilometers is cultivated! HALF of all arable land is cultivated! By inference, we need to know more about pasture and cropland fire practices.
Distribution of agriculture, cropland, and pasture.  Half of all arable land is currently cultivated.

Distribution of agriculture, cropland, and pasture.

Posted in Group News, Research News | Tagged , , , , , , | Comments Off on Pyrogeography at the AAG Conference

Climate change and debate

An interesting article about the amazing climate change humans are causing was published by the UNC Charlotte campus newspaper back in Spring 2014, but it’s worth re-visiting as our atmosphere once again reached 400 ppm CO2 concentration. The piece was published as a point-counterpoint discussion, but as many scientists (include myself) point out, science is not about considering all sides – it’s about considering what the evidence suggests. I wrote a letter in response to the viewpoint that climate change is no big deal. If the evidence from multiple experiments/studies suggests a single point is true, then that’s where the scientific community will tend towards when explaining that science. As the evidence builds and builds with no one finding counter-evidence, the conclusions become more and more robust*. If the evidence suggests mixed or nuanced results, then scientists will talk about that science as inconclusive and continue to try to design better experiments or get more data or both. Most importantly, perhaps, if counter-evidence arises repeatedly, scientific conclusions will change in response. Science is a beautiful, self-correcting process.

In Spring 2014, I sat down with a Niner Times reporter and Twitter friend Ed Averette and talked with him about how I see climate science, and how I talk about the science of climate change in my classroom (most prominently in ESCI 3101, Global Environmental Change). I had a lot to say, mostly because I had just returned from a wonderful conference called the Carolinas Climate Resilience Conference in April 2014, where I talked about Climate Change in the University Classroom (presentation here!), and I met some amazing outreach-oriented people (Kirstin Dow, Greg Carbone, Jim Gandy), and learned a climate change song that could be played on a dulcimer sung by this NPS Ranger. The article Averette wrote is available online and includes a figure I made for my class lectures.

The amazing correlation between Earth's temperature and CO2 concentration in the atmosphere, as derived from multiple ice core datasets shown in the graph itself.

The amazing correlation between Earth’s temperature and CO2 concentration in the atmosphere, as derived from multiple ice core datasets shown in the graph itself.

Another Niner Times reporter, Louis Aiello, provided the (journalistic) opposing viewpoint that there is no need to panic when it comes to the present-day climate change and his article is available online as well. Both articles are worth reading since they echo the innate concern we have for our planet, but that at the same time, the problem can feel overwhelmingly large**. Aiello never spoke with me, or as far as I could tell, any expert in the field of climate science, so of course I agree more with the approach Averette used, and found myself strongly disagreeing with Aiello’s article. I wrote a letter to the Niner Times in response to Aiello’s article, and I wrote a shorter version of that letter as well for the print newspaper. I did this because I often think about this artificial public debate that exists in the face of a broad scientific consensus about many points regarding the present-day climate change, and I also think that scientists need to speak up when they know about a topic.
Screenshot of the print version of my letter that had a limited number of words I could include.  Hence the online letter is longer.

Screenshot of the print version of my letter that had a limited number of words I could include. Hence the online letter is longer.


*Gravity is a good example. Go measure the acceleration if you want, but you’re likely to find the same thing any scientist will find. Acceleration due to gravity is 9.8 meters per second every second that an object falls. Thus, this is essentially a fact in our world, but it arose from evidence, not our gut feeling.

**This philosophy of how a single person drawing from a common resource scales up to major problems is known as the Tragedy of the Commons, which has been spoken about eloquently by many many people, including wikipedia.

Posted in Earth System Observer, Research News | Tagged , , , | Comments Off on Climate change and debate

Climate change and 400 ppm carbon dioxide

In the great carbon cycle that is at work on our planet, carbon dioxide (CO2) gas concentration in our atmosphere, as measured in the most famous observation site in the world (Mauna Loa, Hawaii, home of the Keeling Curve), has risen again above 400 parts per million, or 400 ppm for short. mlo_two_years-2015-01-12This happened in 2014 before CO2 dipped back below 400 ppm, and while 400 ppm is an arbitrary choice to focus on, round numbers typically get more attention than, say, 397 ppm. Think about a baseball player’s batting average, which is hits divided by at bats. Somehow a 0.299 (or “299”) batting average is perceived as worse than a 0.300 (300) batting average, but really, it’s the difference of a few hits (or at bats) in the course of a season. Ted Williams hit 406 in 1941. 185 hits in 456 at bats. 3 fewer hits, and he would have hit 399, and the world would’ve sighed. 3 hits! Back to CO2. I’ll suggest, like many others, that 400 ppm is a good place to step back and think.

What is the carbon cycle?

IPCC AR5 Figure 6.1 is a nearly perfect capture (as it should be given the expertise that developed the figure!), but I boiled away the beauty to a more practical figure for my classes. carbon-cycle-boiled 
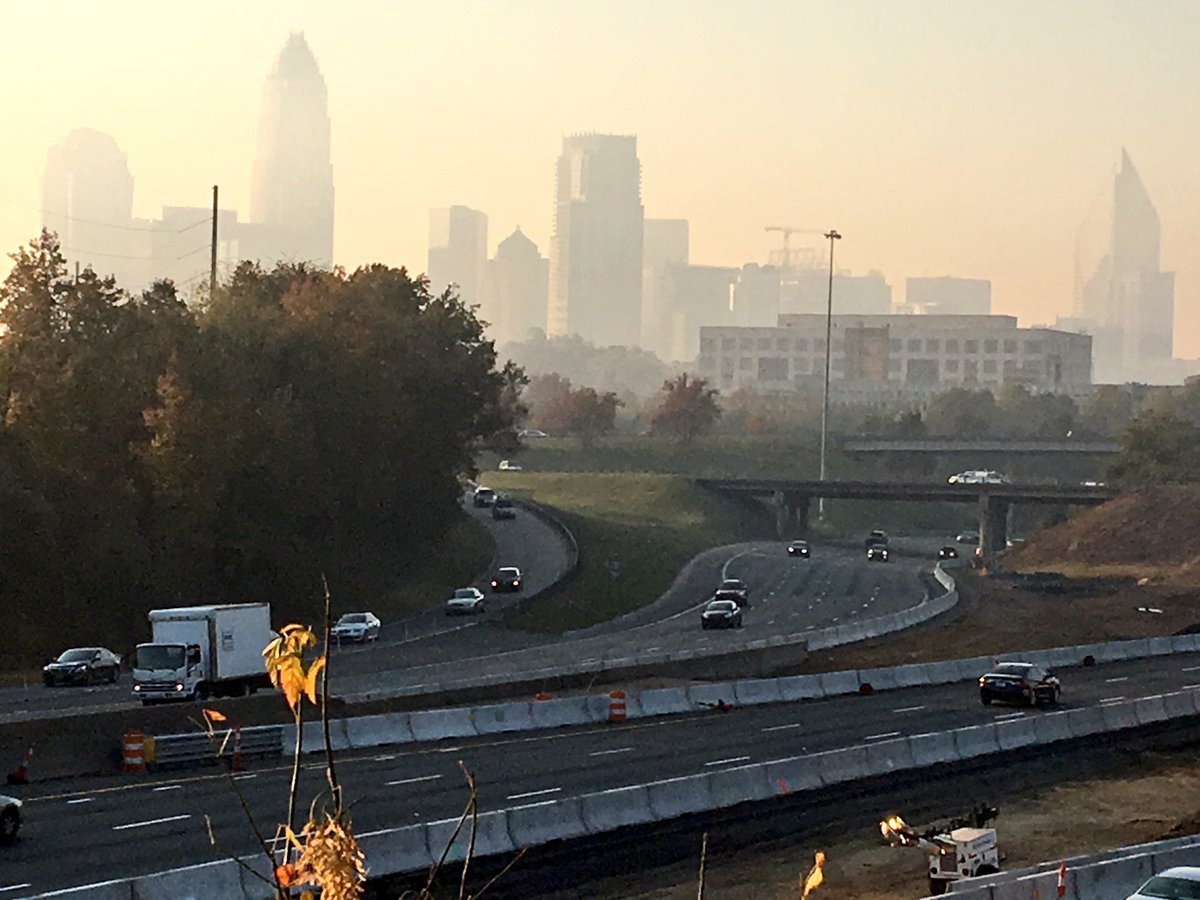
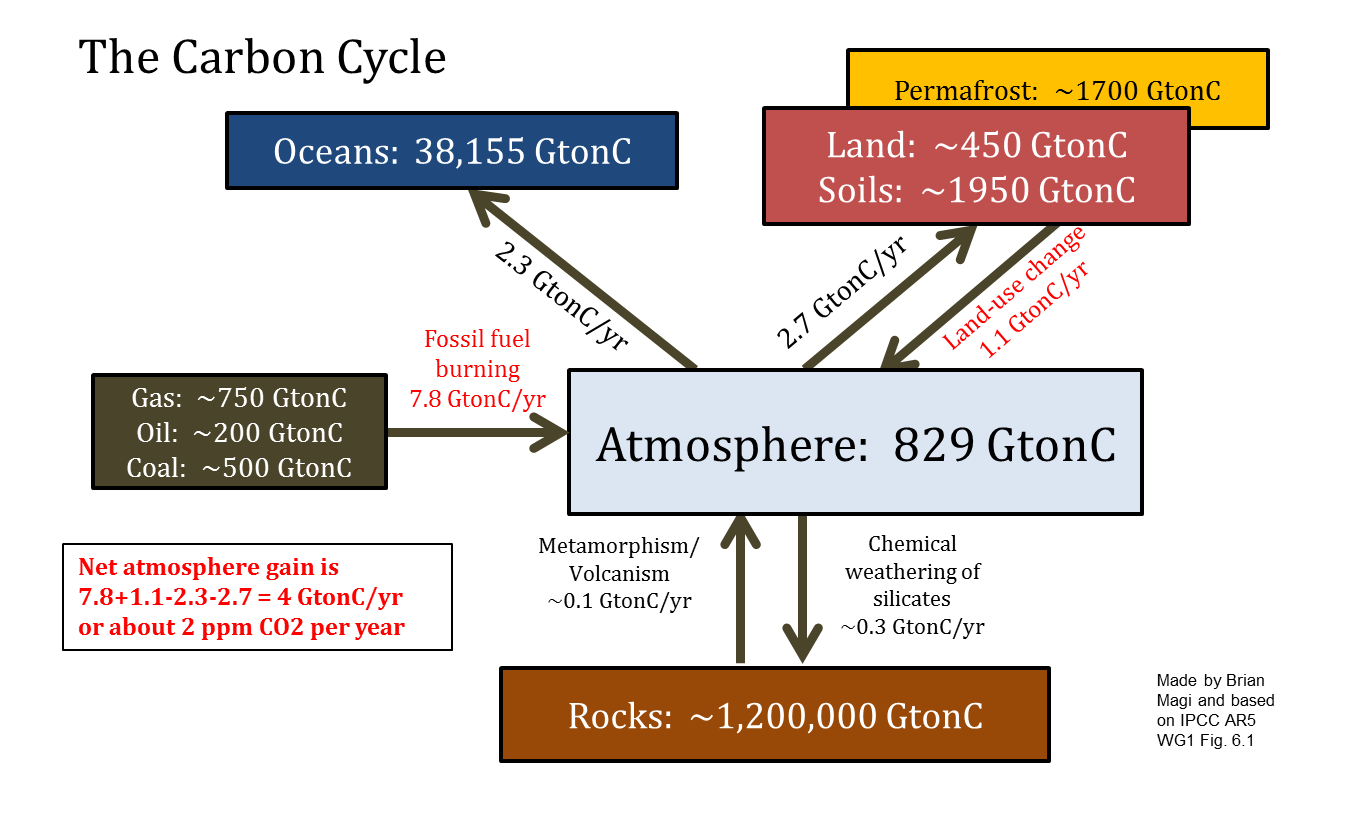
The reason that CO2 goes up and down in any given year is mainly because the Earth breathes in and out. When the Earth breathes in, plants draw CO2 from the air and convert it to plant carbon via photosynthesis. As a result CO2 concentration in the atmosphere goes down. When the Earth breathes out, plants release CO2 into the air via that respiration, the process of decomposition that acts in the opposite direction of photosynthesis. CO2 concentration in the atmosphere then goes up. The breath results in a steady rise in CO2 concentration from October to May, and a steady decrease from June to September. As you would expect, the rise and fall are essentially reversed in when they occur in the Southern Hemisphere, and this is evident in the data as well. As you might also surmise, in the Northern Hemisphere, the enormous number of seasonal plant growth/decay results in a bigger “breath” than in the Southern Hemisphere. Check the graph here to see that hemisphere difference.

The Keeling Curve, and CO2 concentration in general, is a way to “see” a part of the Earth’s carbon cycle, which are all the physical/chemical/biological/geological (biogeochemical, for short) processes that exchange carbon. The exchanges between carbon “reservoirs” (for example, the atmosphere and the land in the figure above) happen at different rates and magnitudes. Oceans store enormous amounts of carbon from CO2, and rocks store even more. The atmosphere is relatively carbon-free, but we are burning carbon from rock reservoirs (fossil fuels), and burning is a combustion chemical reaction that produces many carbon-containing gases and particles, but most fundamentally water vapor and CO2. This CO2 goes into the atmosphere and stays there for a long time. Water vapor goes into the atmosphere too, but leaves the atmosphere within a couple of weeks via precipitation. As a result, the year to year variability shows the Earth’s breath (land-atmosphere exchange), but the long-term trend shows that CO2 concentration itself is increasing when you compare the average from one year to one from a previous year. That long-term trend is showing how more and more carbon from CO2 is being stored in the atmosphere reservoir of the carbon cycle.

We are FORCING the carbon cycle to change by changing the amount of carbon in the atmosphere. That 400 ppm concentration value is a measure of how much carbon from CO2 (in units of mass, like kilograms or pounds) is in the atmosphere. The change in concentration is a measure of how much carbon from CO2 has been put into the atmosphere (again, in units of mass). The pre-industrial concentration of CO2 was about 280 ppm, so 120 ppm has been added to the atmosphere reservoir in the carbon cycle. It’s relatively easy to show that +120 ppm is equal to 284 billion tons of carbon added to our atmosphere.

Most of that 120 ppm is from human activities of fossil fuel burning (moving carbon from rock reservoir) and from deforestation (moving carbon from land reservoir), and 400 ppm is, as far as humans are concerned, completely unprecedented. ipcc-ar5-wg1-Fig6-08 At no time in the past 800,000 years, through several ice ages and enormous climate changes (figure at bottom), has the planet had concentrations of anything close to 400 ppm. Furthermore, it is quite clear from scientific and anthropologic evidence (at least!) that human civilization has evolved in a period of relative stability in Earth’s climate history. CO2 concentration has largely remained around 280 ppm until the last 100 years or so. Evidence that scientists have collected suggest that CO2 and temperature track each other. This is fundamentally why most climate scientists, and most scientists in general, are concerned about short and long term futures.

Humans can adapt and we will have to adapt to some degree, but the changes we are imposing on the planet through the carbon cycle are much faster than anything that we have an analog for in the past through naturally-driven climate changes. This is where carbon mitigation strategies are so critical, and why everyone is talking about the EPA Clean Power Plan, COP20 Lima, China-USA negotiations, and the upcoming COP21 Paris negotiations. These negotiations are about whether humans can live on the world without altering it in ways that more than likely is detrimental before being beneficial. Right now, the science says we are not very good tenants. With 400 ppm CO2, we are breathing air with more CO2 in it than any other human or proto-human has ever breathed. It’s not poisoning us directly, but the increased CO2 is changing how the Sun and Earth-Atmosphere system are interacting with each other. We are forcing the planet to warm as more electromagnetic radiation is absorbed by the unusual excess of greenhouse gases in the atmosphere. The warmth is changing everything, and it will continue.
co2-800k-present

Posted in Earth System Observer | Tagged , , , , , , , | Comments Off on Climate change and 400 ppm carbon dioxide

Attending AMS 2015 in Phoenix

MESAS students Warren Pettee and Thomas Winesett and I will be attending AMS 2015 (#AMS2015), along with many others from UNC Charlotte. I heard the count was about 8 undergraduate students from the Meteorology Program. Professor Casey Davenport and I will be the faculty representation at AMS – she and I make up 50% of our Meteorology faculty! Dr Davenport and I are also going to be a the AMS Career Fair with a big green UNC Charlotte table. We’ll be talking to anyone interested in learning more about the graduate and undergraduate programs in Atmospheric Sciences, Geology, Earth Sciences, and Geography at UNC Charlotte. Should be fun! Especially if we put out Andes mints.

For presentations, check my publications page for PDFs of the posters, but here is the summary with some images.

Thomas is presenting his poster twice, once at the AMS 14th Student Conference, and once at the AMS 7th Conference on the Meteorological Applications of Lightning Data (MALD) on Monday.

Thomas's AMS 2015 poster

Thomas’s AMS 2015 poster (co-authors are myself and Dr Dan Cecil, NASA MSFC)

Warren is presenting research about his version of WRF and how it performs for the February 2014 Snow Event in Charlotte at the Student Conference.

Warren's AMS 2015 poster (co-authors are myself and Professor Matt Eastin)

Warren’s AMS 2015 poster (co-authors are myself and Professor Matt Eastin)

I am presenting my paper, recently accepted for publication in JTECH, at the 20th Conference on Satellite Meteorology and Oceanography on Monday.

My AMS 2015 poster for the 20th SatMet conference.  Based on a paper that will be published at JTECH

My AMS 2015 poster for the 20th SatMet conference. Based on a paper that will be published at JTECH

Posted in Group News, Research News | Tagged , , , , , | Comments Off on Attending AMS 2015 in Phoenix

Funded graduate research assistant for fire modeling project

This is an advertisement I am circulating around to listserves and colleagues to recruit a graduate student (Masters or PhD) into my recently-funded NSF research project. The grant title is “Collaborative Research: Testing Hypotheses About Fire Using Data Syntheses and Fire Modeling” and I am working with researchers at Yale University (Dr Jenn Marlon) and University of Oregon (Dr Bart Bartein) to better understand questions related to the intersection of global fire modeling and paleofire data. The NSF public project summary is here. The recruiting ad is below. Please consider applying! Email if you have questions, or I’d be happy to meet with you at SEDAAG (Athens, GA), AMS (Phoenix, AZ), or AAG (Chicago, IL). Thanks!

Dr. Brian Magi is seeking a graduate student to join the Multidisciplinary Earth System and Atmospheric Sciences (MESAS) research group in the Department of Geography and Earth Sciences at the University of North Carolina at Charlotte (mesas.uncc.edu). The student will develop research within the context of an NSF funded project focused on studying how global fire modeling can use past and present data to investigate the interactions between fire, climate, and land-use change over a range of time scales. Students will join a multi-institution research team and will engage with an international effort to improve our ability to understand and model fire in the Earth system.

Applicants may apply as a Masters student, or, if they hold an MS degree, as a PhD student. Regardless, applicants should have at least one degree in atmospheric sciences, geography, earth system science, or related field in the physical sciences. The ideal candidate will have a strong quantitative background and computer programming experience, as well as interest in interdisciplinary topics related to climate-human dimensions of global fire activity.

The funded position is available for 2 years, includes tuition, and starts in August 2015. To apply, please email Dr. Brian Magi (brian dot magi at uncc dot edu) a cover letter describing your research interests, goals, and relevant experience, a CV, unofficial college transcripts, GRE scores, and contact information for three references. Questions should be sent to the same email address.

Review of applications will begin immediately and the position will remain open until a suitable candidate is found. After the selection, the successful candidate will apply to be admitted to appropriate UNC Charlotte graduate program; detailed information about the application procedure to the Department of Geography and Earth Sciences is available online (geoearth.uncc.edu).

Posted in Group News, Research News | Tagged , , , , | Comments Off on Funded graduate research assistant for fire modeling project

Call for Abstracts for Pyrogeography session at AAG 2015

This is a post that I will link via twitter. If you are interested in presenting your Pyrogeography research at the Association of American Geographers 2015 annual meeting in Chicago in late April 2015, please submit an Abstract and send your AAG PIN to me or another session organizer. AAG Abstract deadline is November 5.

Our other Pyrogeography session co-organizers include Paul Laris (CSU Long Beach), Jenn Marlon (Yale Univ), Michael Coughlan (Univ of Georgia Athens), and Leif Brottem (Grinnell College).

—————-

Call for Abstracts AAG 2015

Title: Pyrogeography

Description: Pyrogeography seeks to understand the spatio-temporal patterns of fire as a function of the complex interplay of human and environmental factors. Over the past century, there have been enormous changes in human perceptions and uses of fire around the world. Moreover, climate and fuel conditions have been rapidly changing in recent decades, further altering interactions between fire and its various controls. Fire researchers are increasingly seeking ways to integrate multiple perspectives and sources of data and information to better understand the changing dimensions of fire regimes, whether expressed through shifts in extent of area burned, fire frequency, type, severity, or seasonality. All methodological approaches are welcome and we especially welcome mixed-method research approaches. Research approaches may span local to global scales, and include diverse approaches from geography and anthropology, based on paleoecological, dendrochronological, archaeological, historical, satellite, mixed-methods, and other modern approaches, as well as global and regional fire modeling research, and fusions of these methods.

Session co-organizers include: Paul Laris [Paul.Laris at csulb.edu], Brian Magi [brian.magi at uncc.edu], Jennifer Marlon [jennmarlon at gmail.com], Michael Coughlan [coughlan at uga.edu], and Leif Brottem [brotteml at grinnell.edu]. Contact any of the co-organizers if you are interested in participating or have questions.

——————

Fires in January 2014

Fires in January 2014 from NASA Rapid Response

Fires in September

Fires in September 2014 from NASA Rapid Response

Fire images are from NASA Rapid Response.

Posted in Earth System Observer, Research News | Tagged , , , | Comments Off on Call for Abstracts for Pyrogeography session at AAG 2015

Robust features in the 2014 USA forecast

Building on a previous discussion about a seasonal forecast product from NOAA Climate Prediction Center (CPC), I am still really curious about how robust the features in the seasonal weather patterns in the USA are. “Weather” in this case is referring to temperature and precipitation (T and PCP), and features refer to 3-month boxcar averages of T and PCP anomalies compared to the corresponding 3-month climatologies. So this is not the normal day-to-day weather or even the recent weather. Here are some new figures, which I explore below in terms of features that seem to be “robust” and features that seems to be “ephemeral”.

First, temperature in two plots:

comparisons-2014-3-start

Then, precipitation in two plots:

comparisons-precipitation-2014-3-start
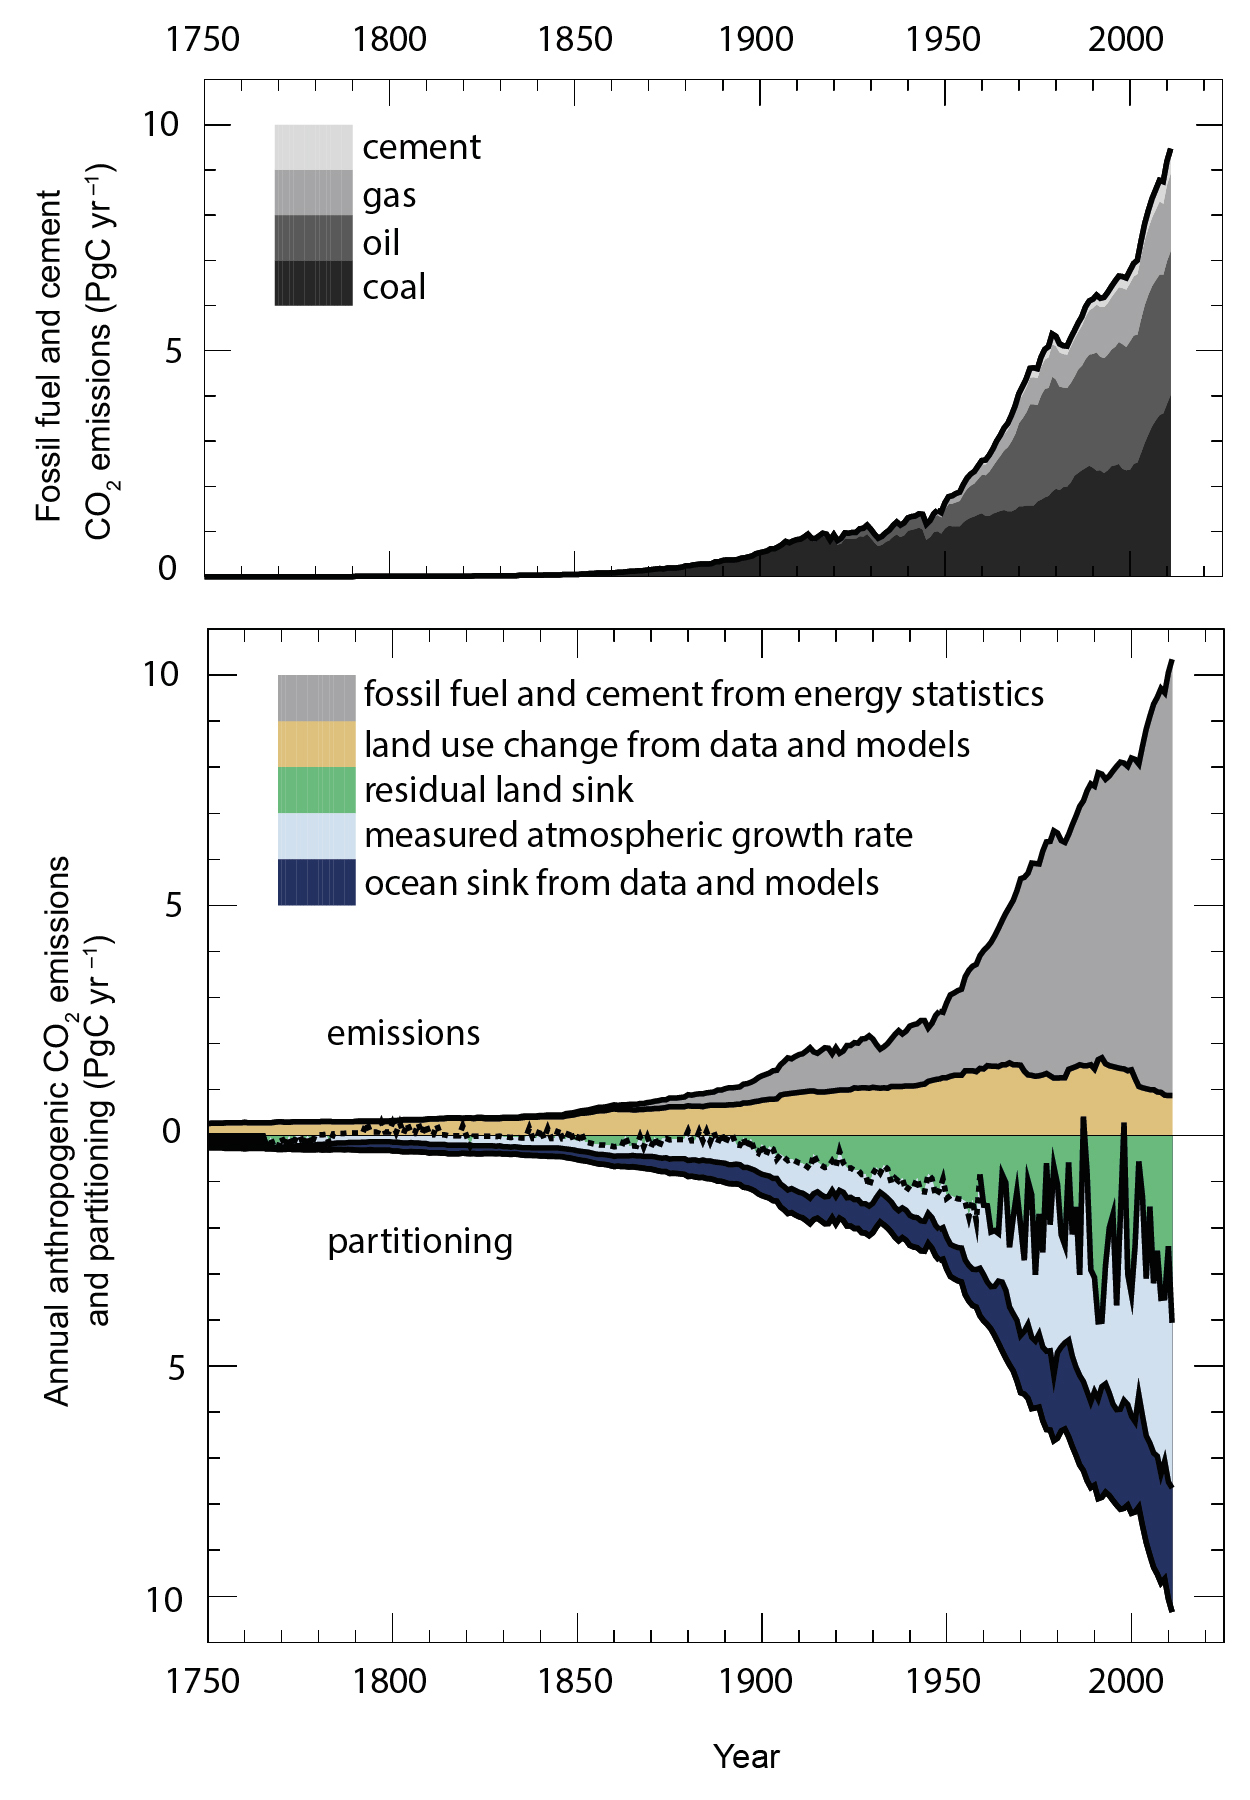
Watch the figures carefully. All the animations start with a forecast for 3-month averaged T and PCP for March-April-May (MAM). Then, they step forward to April-May-June (AMJ)The CPC data product seems intended to provide an idea of whether T and PCP will be above or below average for the USA (including Alaska). In a previous discussion, I looked at CPC outlooks for 2014 and early 2015, and their figures and analysis were produced using actual mid-January 2014 conditions.

New data

Now another month of data is in and CPC has updated their seasonal forecast to begin with mid-February 2014 conditions. A natural expectation is that the seasonal forecast would be better earlier in the overall forecast period. In other words, as the animation above progresses, the confidence in the forecast should decrease with time. Sometimes, however, larger patterns of atmospheric variability that emerge somewhere else in the world can exert some level of control on weather patterns (T and PCP) in the USA. El Nino-Southern Oscillation (ENSO, or sometimes just “El Nino”) is the best known example.

There could be all sorts of speculative lines of thinking in terms of causes, so for now, I’ll focus on the features that seem to hold up after another month of data. I’ll call these robust, and point out one overall theme that is worth watching as winter releases its grip on much of the USA.

Robust Features

The Southwestern USA and often the Western USA in general is facing what will likely be a warmer than average year until about October. I think this is a pretty safe prediction. There is almost no evolution after more data was considered, except perhaps that the Pacific Coast tends towards higher probability of above average warmth. Upper Alaska is also holding up to the earlier forecast of warmth, especially in the northernmnost reaches. Both these regions are well known as fire prone under unusual warmth. Uh-oh. By November-December, the above average warmth shifts to the mid-Atlantic and the Southeast USA. The Northeast USA drifts towards unusual warmth starting in the summertime, maybe July, and ending about, oh, early next calendar year. For precipitation, much of the USA seems to be a normal water year. The problem is that in the near term, California remains dryer than average. Other features in a featureless prediction are that the deep South is dry in the spring, while the Ohio River Valley is wetter than average. Northern Florida and the coastal SE USA tend towards dry late in the calendar year.*

Summary and What the AVERAGE Year Looks Like

Overall, the story remains clear: The USA should experience another warmer than average year. Warmer than average is a relative term. Remember that NOAA (and CPC) define the normal temperature and precipitation amounts by the 1981-2010 30 year average. This is a particularly irritating 30 year timeframe mainly because climate is clearly warming most rapidly during the 1970 to present day period. It is what it is, but sometimes the simpler message is lost. The CPC forecast is for a year that is warmer than the 1981-2010 average. So what is the 1981-2010 average?? This is what the 1895-2013 temperature and precipitation trends for the contiguous USA (no Alaska) from NOAA NCDC with the baseline average 1981-2010 average temperature overlaid.contiguousUSA-1895-2013-annual-TcontiguousUSA-1895-2013-annual-P
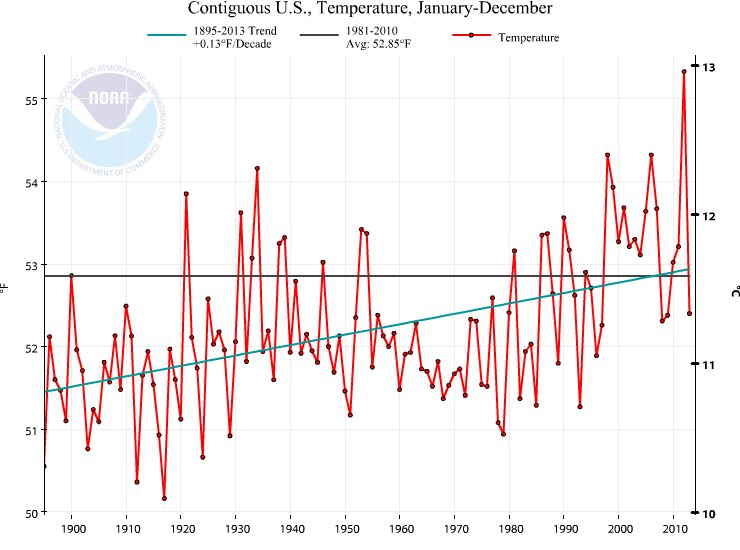
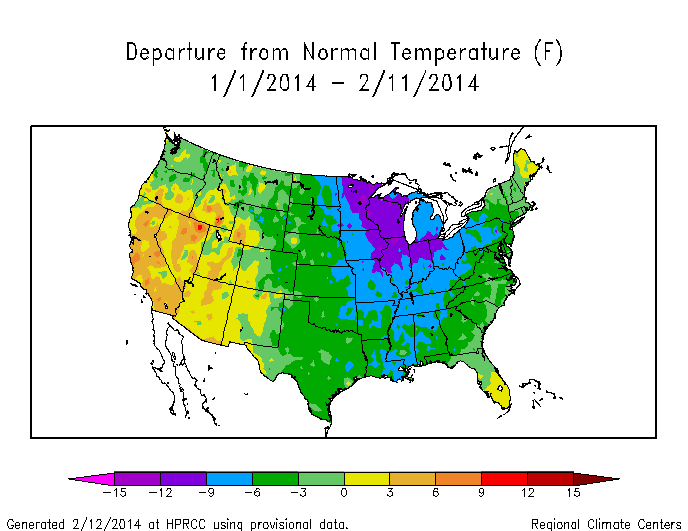
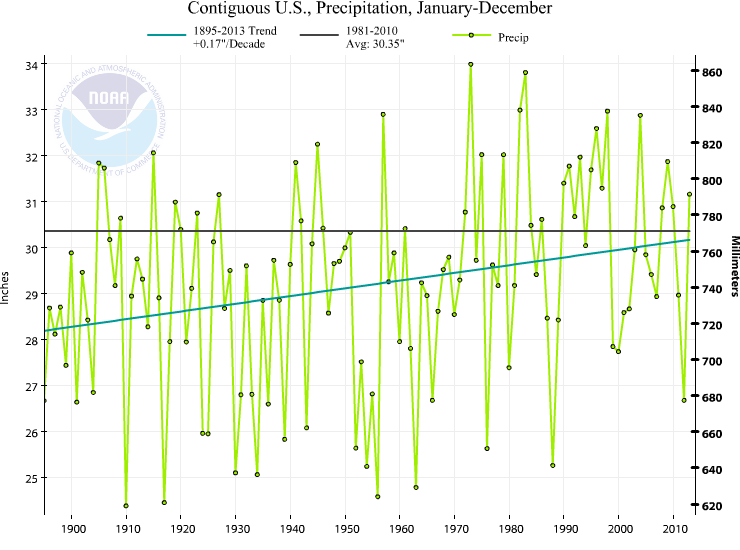
The precipitation is not the story, in my mind. The story is that we should expect a warmer than 1981-2010 year. The average of 1981-2010, without doing any math, is clearly warmer than most of the years this past century. Quickly eyeballing this number says that 82 of the 100 years in the last century are colder than the 1981-2010 average. This is really important in terms of perception of the significance of a warmer than “average” year. 1981-2010 is not a very good choice for the “average”. Gonna be a warm year according to CPC. Nowhere is there a robust and spatially significant feature suggesting below average temperatures, by the way.

*There are a few features that are not that robust, by my admittedly weak definition. For example, it’s not that clear whether the NE USA or the NW USA will tend warmer than average in the early summer. And precipitation has about the same number of features that are robust as not robust.

Posted in Earth System Observer | Tagged , , , , , | Comments Off on Robust features in the 2014 USA forecast

Forecasting the USA temperature and precipitation tendency for 2014

Where we are this calendar year

Currently, the USA as a whole and the Southeastern USA are both cooler than normal this year 2014-02-12-YearTDeptUS and precipitation is slightly below average for the Eastern USA, above average for Colorado-Wyoming-Idaho, and well below average for the Southwestern USA. 2014-02-12-YearPNormUS

Where we are right now

Thinking about the upcoming year in weather while in the midst of a crippling snow/ice storm in the Carolinas (discussion via #NWSGSP, over 2,000 outages by end of 12 Feb 2014 mostly in Lancaster, Greenville, and Pickens Counties in SC, and Macon and Caswell Counties in NC*, flights cancelled, Rayleigh-Durham turning into a parking lot like Atlanta only two weeks ago, etc.) is the perfect time to test whether you can separate a trend from variability (teach me, dog walker).

*updated on 13 Feb 2014 midday is 36,400 outages; more than 14,000 in Mecklenburg, 4000 in Cabarrus, 2700 in Gaston, 1600 in Rowan, 1300 in Lincoln, and 1100 in Durham County, NC. About 5000 in Lancaster and 2900 in Chester County, SC. Wow. Second band of snow falling in North Mecklenburg dropped maybe another 6″ on the 5-6″ we had yesterday. Double wow. Snow and ice totals should be impressive after the analysis is complete.

Trend, variability, and perception

The temptation is that your opinion is tempered by what you are currently experiencing. The old and boring argument that “Hey, it’s cold. What’s up with global warming?” The short-story (pun intended) is that weather is always variable, and the #SEStorm snow and ice storm is no exception.

What is the trend? Globally, it’s simple. Temperature is increasing (NASA GISS, UK Met Office CRU, NOAA NCDC). For the USA, and states within the USA, it’s less simple. Variability in the weather tends to average out less and less over smaller and smaller spatial scales. What does this mean? The ups and downs we expect from weather like our February snow/ice storm and the preceding week with beautiful warm temperatures become less and less noticeable at larger spatial scales because while North Carolina might be down in temperature, somewhere else on Earth is certainly up on temperature. They average out unless there is an overriding trend, like the trend imposed by increases in greenhouse gases. That’s why the global temperature trend is so important. If something is making the entire Earth warm above what is considered a range of natural variability, then some very powerful mechanism is at work.

Where we might be this calendar year

Back to the question at hand though. Can science address near-term (say, over the next 3-12 months) temperature and precipitation? The answer is yes, and this prediction is studies using an analysis called seasonal forecasts. I was shocked by what is suggested for temperature for the rest of 2014 and slightly into the beginning of 2015. NOAA Climate Prediction Center (CPC) updates their seasonal forecasts about the middle of every month, and I put this animated version of their graphics together below. temperature-2014-01-16
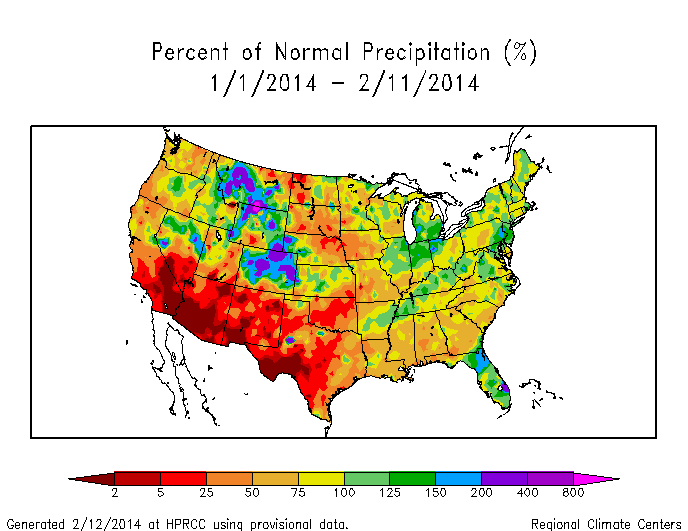
where, once you wrap your head around what I call the “geography” of the figure, you see that NOAA CPC is predicting whether the temperature over successively farther 3-month periods (Feb-Mar-Apr, Mar-Apr-May, etc.) will be above, at, or below the average temperature for 1981-2010 (the climate normal). Clearly, NOAA CPC analysis is suggesting that the USA is due to experience an above-average year for temperature. In particular, the Southwest and Alaska are pummeled by warmer-than-average temperatures until October (a hot summer in the Southwest is not pleasant, and hot summers in Alaska may be suggestive of a bad fire year). Furthermore, by about October-November, the forecast for the Southeastern USA is to be above average temperature even after the rest of the country goes to even chances for above or below-average temperature. That translates to a nice Halloween and Thanksgiving in the short-view, and yet another warm blip on the global warming trend in the long-view.*

Precipitation seems to be less interesting in terms of climatological deviations, but the Southwest does seem to at least move away from below-normal, dry conditions that are plagueing California right now. precipitation-2014-01-16

*I’ll revisit the seasonal forecasts again in a couple of weeks after NOAA CPC updates their analysis, and then also look at how well the forecasts capture reality at the end of the year using NOAA NCDC archived temperatures. This verification is mainly because I haven’t spent much time with these seasonal forecasts, but I am always seeking out new media for the classroom. A natural question about the NOAA CPC products is: Are they any good? We’ll see.

Summary

A lot to digest, and time will tell, but don’t let this cold early part of 2014 deceive you. Global warming is a major trend that is imposed on every weather system in the world. No single weather events is very likely attributable to global warming because of the complexity in parsing out all the causes and effects that modulate a weather system as it tracks through the USA (think of how tricky the forecast of ice vs snow was for this Feb 11-13 storm, and then try to say what it was that caused that specific location of the border between the two – hard!). But the average weather is slowly changing, and the average weather is climate. In the meantime, back to staring at the sleet that is falling and wondering when UNC Charlotte will open again for classes!

Posted in Earth System Observer | Tagged , , , , , , | Comments Off on Forecasting the USA temperature and precipitation tendency for 2014