Climate in the Southeast in January 2014

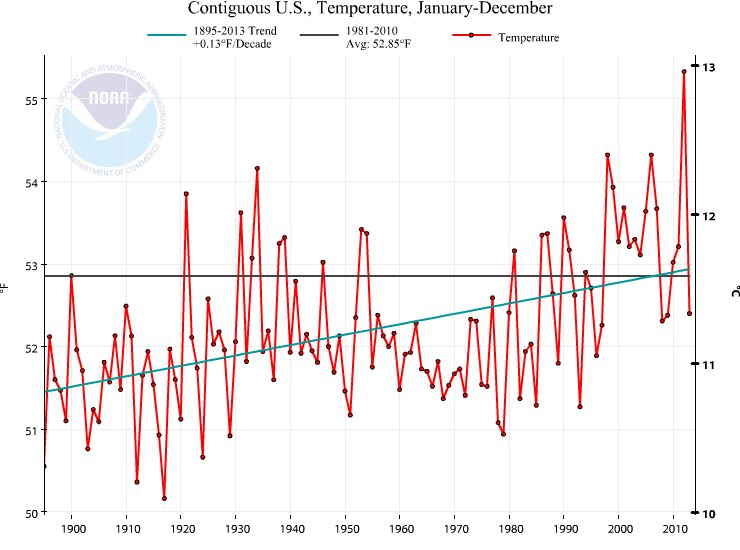
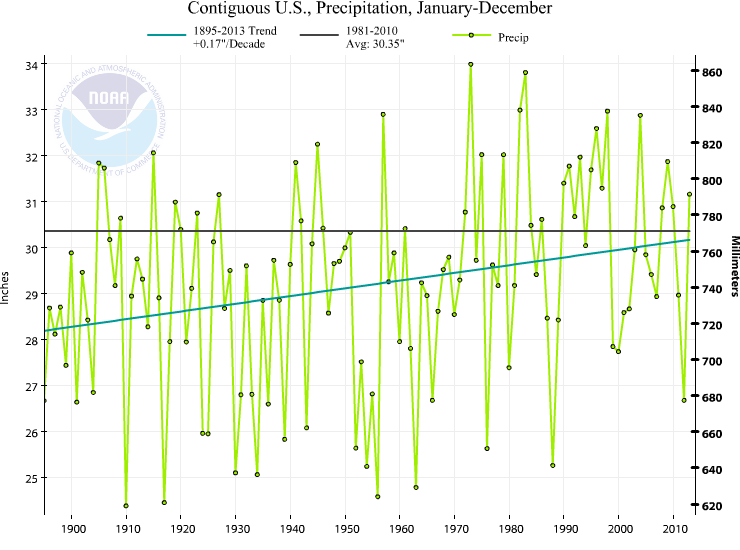
Scientists studying the Earth’s climate system are supported by an immense and rich array of data. Sometimes it seems like you only have to be comfortable working with all this information. Programming languages help (matlab, R, python, NCL, for example). But even more accessible are incredible web resources. The USA High Plains Regional Climate Center updates their climate and weather relevant maps on a daily basis. Here are some figures showing where the country and the southeast USA stands. From NCDC time series plotter, the contiguous USA (no Alaska and Hawaii) was the 37th warmest year in the last 119 years, as shown in the graph below.
contiguous-USA-2013-T
In itself, 2013 wasn’t unusual. In recent memory, 2008 and 2009 were really similar to 2013. However, compared to the fanfare around the hottest year on record for the USA in 2012, it does seem different. Who can remember ought-8 and ought-9, right?

But even more to the point is what we feel where we live. Science and statistics are fine, but just like no one on Earth experiences the average global temperature, no one in the USA experiences the average USA temperature either! Let’s look at the Southeast. In 2013, drawing from the HPRCC link above for the figures below, the temperatures were cooler than average.
AnnDec13TDeptSERCC-2013-12-31
In the last 120 years, 2013 in the Southeast was about the 67th warmest. Most of the years in the past 120 years have been warmer! But this is really not that ususual. 4 of the last 10 years in the Southeast have been cooler than more than half the past 120 years. 10 years is a limited view, but I chose it because it’s a round number and because we remember the last 10 years. Going back to the USA, *none* of the last 10 years have been cooler than more than half of the past 120 years. Not really even close. You can verify this with NCDC data tools. What global warming? Well, that’s where perception matters. The Earth is warming, even if the Southeast seems to be avoiding the problem we’ve created with CO2 emissions.

Looking to the more recent period, we can also glean a little bit about our winter months with a 3 month average (Nov-Dec-Jan) using HPRCC again
Last3mTDeptSERCC-2014-01-31
We see that except for Florida, the Southeast is largely cooler than average. Here HPRCC is comparing against the 1981-2010 average temperature (temperature anomaly). Appalachia and further to the west are in a deep recession of the warmth we expect when we think of global warming.

Finally, we can look at January 2014 using HPRCC tools.
Last1mTDeptSERCC-2014-01-31
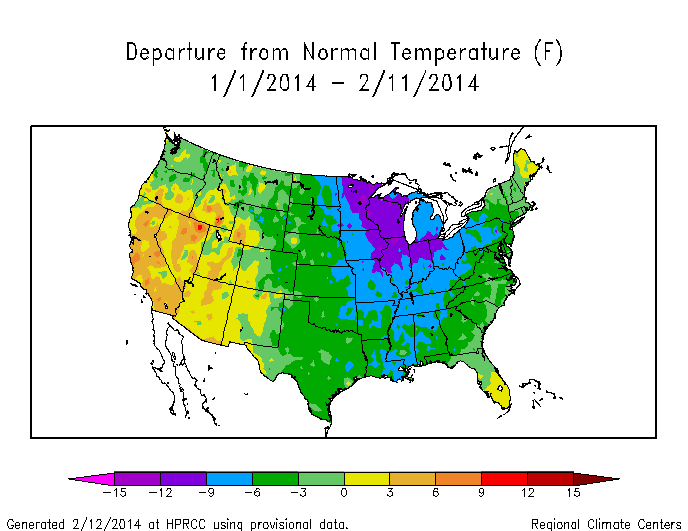
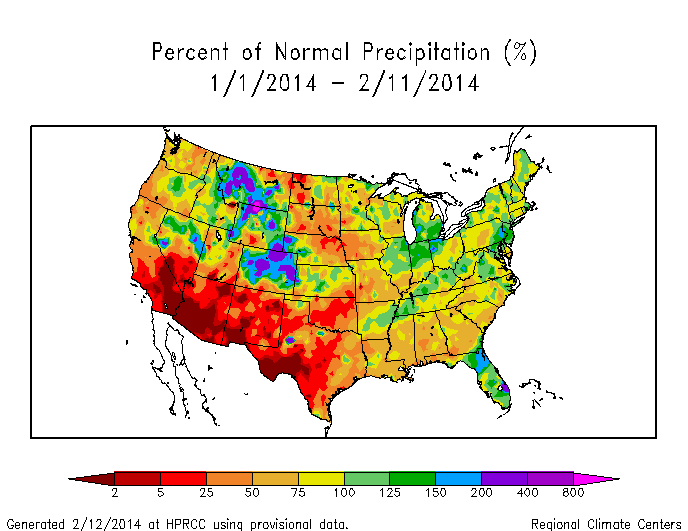
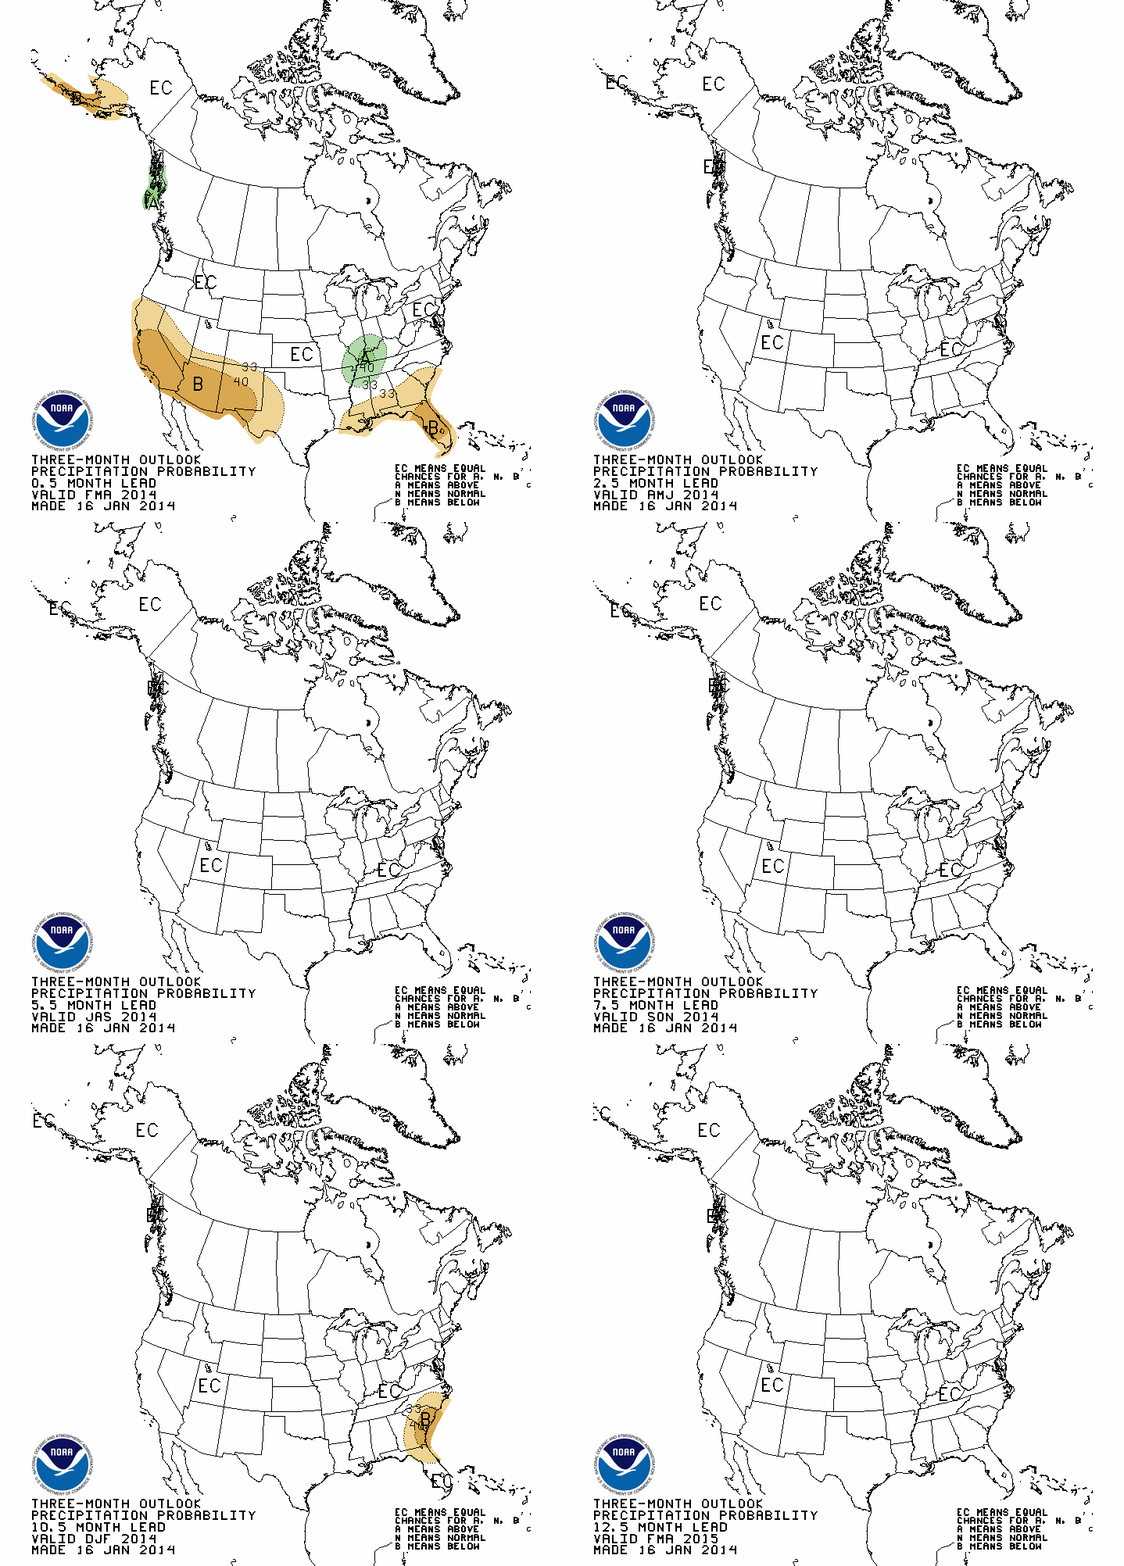
The Southeast is cold! Even poor Florida, which over the last 3 months is anomalously warm compared to the rest of the Southeast, is in a deep cold this past January. If we eyeball-average the data on the figure, we get a number of about 6-7 degrees F below the 1981-2010 average. Jeez. Where can we go for unseasonable warmth (retrospectively)? The West is certainly above average, and more importantly below average on precipitation, as the figures show below.
Last3mTDeptUS-2014-01-31
Last3mPNormUS-2014-01-31
Be thankful the Southeast is so stubbornly refusing to budge on global warming… but I worry that as a result of this stubborness, our legislators will forget this is a problem. North Carolina will be affected even if we are a hold out for now. Think global whenever you think of climate. Or, if you want, think of Bob Marley (one love, one heart). This figure from the recent IPCC report (WGIAR5-SPM_Approved27Sep2013) shows that there are only a couple of non-red areas on Earth (ie. they are not following the warming trend). The Southeast is one of them! But that is one scorched Earth otherwise.
ipcc-ar5-wg1-spm-fig1

Posted in Earth System Observer | Tagged , , , , , | Comments Off on Climate in the Southeast in January 2014

Voting for action on global environmental change

global-201101-201112As real as global warming (figure above from NOAA NCDC) is, and as much as we expect that the science has done enough, one US lawmaker recently said

I am for global action on climate change. I am a proud supporter and very anxious for the U.S. to participate globally. But I think if you look at the current makeup of the U.S. Senate, it’s very difficult.

This is a quote from Senator Ben Cardin (D-Md.) that I drew from a recent article that I’ll get to below. As I close off discussions with 28 undergraduate students of Earth Sciences, Geology, Meteorology, and Economics this semester in my Global Environmental Change course, the questions that permeate their responses to readings* we went over in class are

1. WHAT CAN WE DO?
2. WHY AREN’T WE DOING ANYTHING?

I bring a lot of current discussion into the classroom – more than the previous iteration of my course and I await my course reviews and student comments to better understand which materials resonated and which did not. In the meantime, my answer to the driving questions for the future of our state and country is simple: VOTE. Vote for the legislators that work on issues that you think benefit the global community.

The simplicity in my answer is partly because I don’t have a better answer, but partly because this is where the science stands. Namely, science has arrived at robust conclusions based on decades of intense research by communities of experts, most recently evidenced by the full report of the IPCC. Earth scientists keep working on issues because we are interested in what makes the physical world tick, and just like any community of professionals, the majority of us work on science that is relevant. The most relevant Earth science is climate science. I think it is safe to say that most Earth scientists want to see some actual climate action rather than the empty words that most that most of the action statements by politicians have amounted to so far. A widely-cited scientific paper about a way to visualize and break down carbon mitigation strategies into manageable parts said that the choice is simple: Act or delay.

If we want action, we cannot rely solely on science and engineering – we need policy makers. Policy makers are elected by people. So if my students want to help, vote. If citizens in general want to help, then vote. An interesting report by Lisa Friedman at Energy and Environment News included quotes from US lawmakers about the upcoming 2015 Paris climate meeting that many were hoping would be much farther along after this year’s Poland climate meeting. I’ll include several below:

It will be difficult to get a treaty passed in 2015 in the U.S. Senate as it is presently constituted

———————————–> Sen. Ed Markey (D-Mass.)

Keep our eyes on the prize of creating an ambitious, effective and durable agreement. Insisting that only one way can work, such as an agreement that is internationally binding in all respects, could put that prize out of reach.

———————————–> U.S. Special Envoy for Climate Change Todd Stern

[A binding agreement is] not going to go anywhere. It’s dead on arrival… [EPA limits on CO2 emissions from future power plants are] hurting our economy on a daily basis.

———————————–> Sen. John Barrasso (R-Wyo.)

There is a lot of difference of opinion among very educated people on the science [of global warming]. [On whether a binding agreement would pass the Senate: ] I kind of doubt it. There is still a legitimate question of science, and you can’t brush that away.

———————————–> Sen. Orrin Hatch (R-Utah)

I think this [a global climate treaty] is an issue that can flip very quickly. [An EPA regulation, for example, would] put a lot of costs on polluters and cause them to rethink the wisdom of an economywide carbon fee. If we can organize the armies on our side, it’s a rout. We just haven’t bothered to organize them. [The fact that climate is back in the political discussion and may be in 2014 means] that adds up to 2015 being a pretty good year.

———————————–> Sen. Sheldon Whitehouse (D-R.I.)

This problem is global, not just related to any one country or only one region. We need an international effort, and I think there’s growing support for that in the United States.

———————————–> Rep. Henry Waxman (D-Calif.)

We need to set a good example to the rest of the world. That way, when we call on China and India and other big emitters, we can say not only ‘Do as I say,’ but ‘Do as I do.’

———————————–> Sen. Tom Carper (D-Del.)

Increasingly, the U.S. is being viewed as a leader. Especially if the administration takes action on coal-fired power plants, I think it will be very hard, then, for China and India to say the U.S. is not acting.

———————————–> Sen. Ed Markey (D-Mass.)

[Action might require] some kind of catastrophe… I think [global warming and subsequent impacts are] real, and I think that we should continue to explore our options to reduce the effects of it. [He has not liked] anything I’ve seen lately [about how the UN climate process has influenced US lawmakers.] [Still, he conceded,] I don’t think talking hurts. It probably helps.

———————————–> Sen. John McCain (R-Ariz.)

Are pathways opening up? Has Obama been able to set up his position strongly enough to promote policies that are in line with the science? Well, it comes back to the simple solution: Vote for what you believe. I would argue that your political party – socially or economically – is not the relevant part of a vote that supports climate change policy.

As Professor Andrew Dessler argues in his book, and as many other climate and climate policy scientists argue, the decision to move away from energy sources with high carbon emissions is completely reversible – if the climate science summarized in the IPCC reports is entirely wrong or even partly wrong about carbon cycle science,

Figure 2 from Chapter 6 (Carbon and Other Biogeochemical Cycles) FAQ 6.1 of IPCC AR5 Working Group 1.  Shows that some fraction of a 5000 GtC pulse of carbon emissions - on scale with a pulse from burning all fossil fuel reserves - would affect the atmosphere for 1,000s to 100,000s of years.  Roughly 40% of the pulse would remain in the atmosphere even after 2000 years.

Figure 2 from Chapter 6 (Carbon and Other Biogeochemical Cycles) FAQ 6.1 of IPCC AR5 Working Group 1. Shows that some fraction of a 5000 GtC pulse of carbon emissions – on scale with a pulse from burning all fossil fuel reserves – would affect the atmosphere for 1,000s to 100,000s of years. Roughly 40% of the pulse would remain in the atmosphere even after 2000 years.

we can always go back to burning the least expensive energy sources without regard to the environment. But if climate science is even close to right, then we are facing irreversible changes (see the figure above) to the carbon cycle that will affect the Earth for centuries, millenia, and even further.

As I told my students, the questions that we face are civilization scale (echoing Rep. Waxman’s quote above). Human civilization emerged as a presence on Earth somewhere between 20,000 and 200,000 years ago. I’m no archaeologist, so that number isn’t particularly important. The point is that dinosaurs managed to survive for 165 million years on Earth and evolve into the Cretaceous Period species that we know and love (tyrannosaurus rex, triceratops, etc.). It sure would be nice to think that our advanced technology means we can learn to live in harmony with the planet longer than the dinosaurs! Considering that the dinosaurs were finally offed by a meteorite, I’d say we have a lot to prove still.

*readings from Elizabeth Kolbert, Andrew Dessler, IPCC AR4 and AR5, news posts from New York Times and Washington Post, and multimedia presentations such as Thin Ice, Earth The Operators Manual, and data visualizations and tools focusing on climate-relevant data like carbon emissions, temperature records, and climate model projections

Posted in Earth System Observer | Tagged , , , , , | Comments Off on Voting for action on global environmental change

Human and climate connections with fire activity

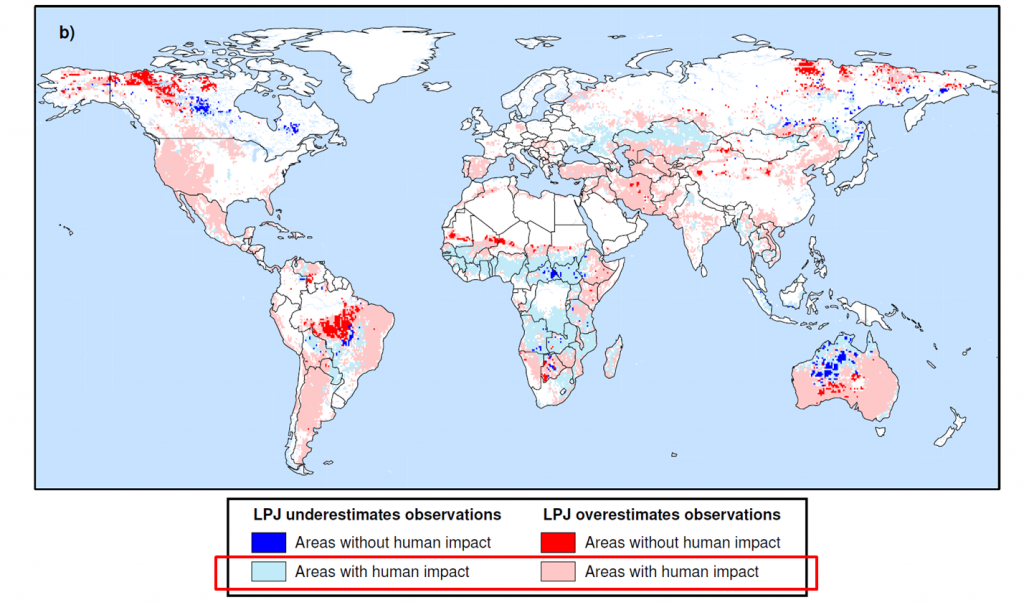
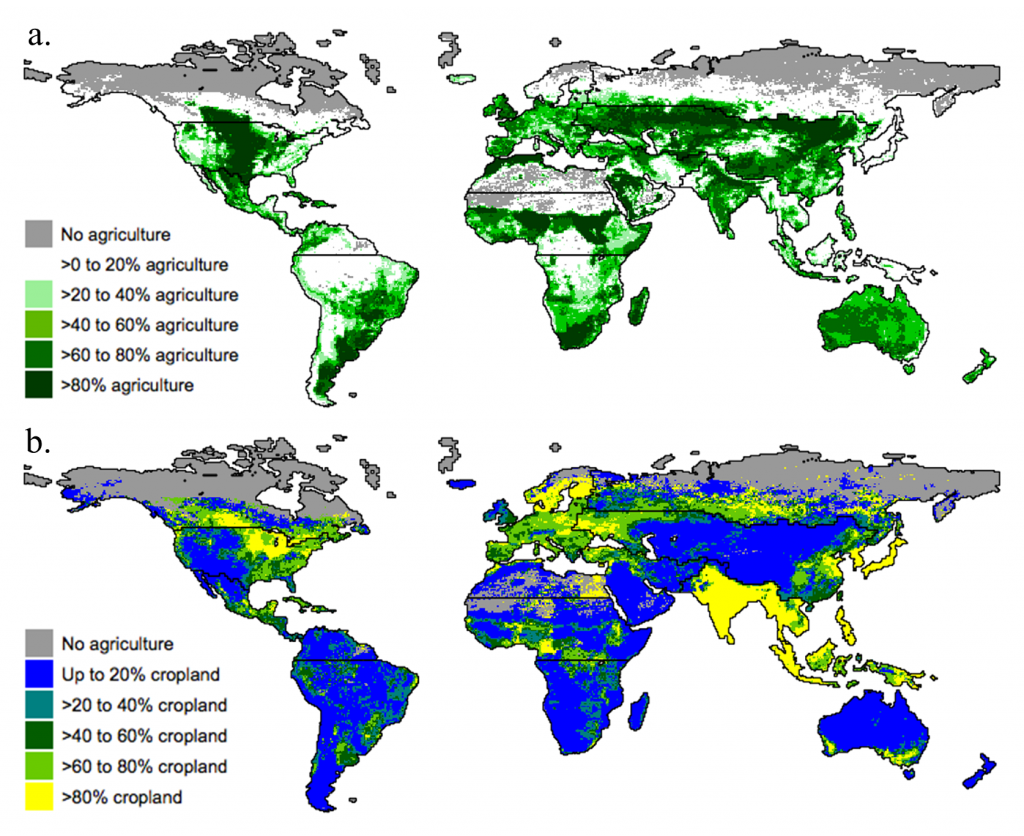
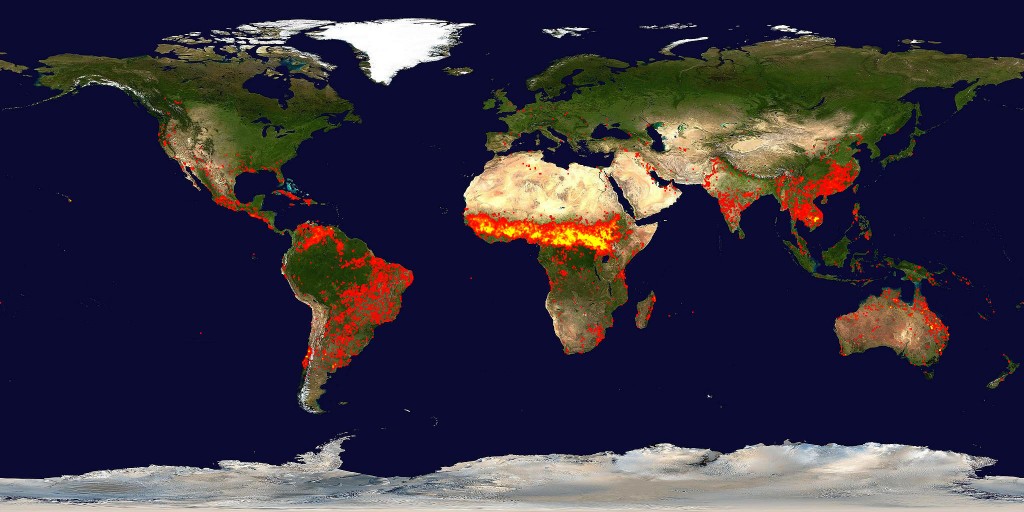
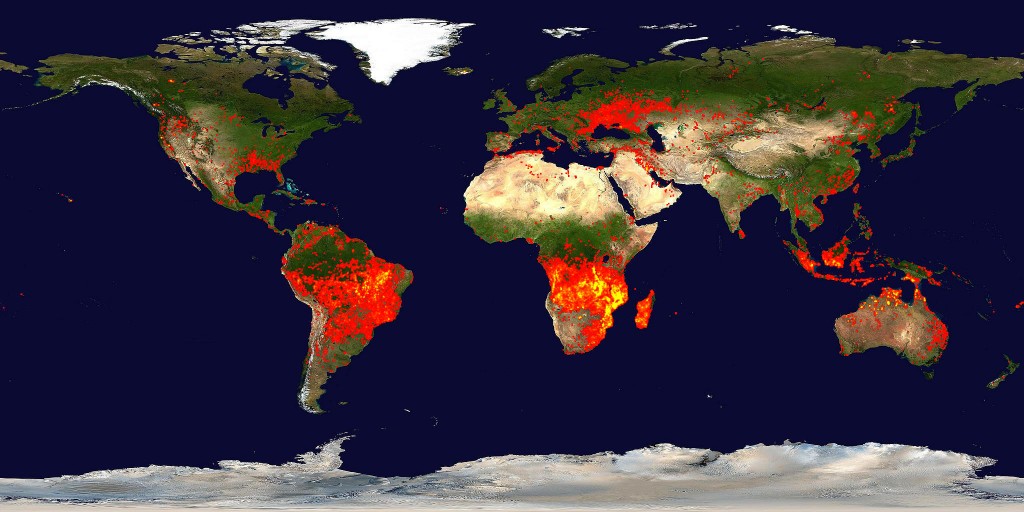
Last week, I got to revisit my research in an informal UNC Charlotte CAGIS Seminar amidst the teaching responsibilities that swarm in on me during the academic year. This forced me to set aside some time to think about research, and also to prepare for an upcoming talk this Friday by an ecological anthropologist named Dr. Michael Coughlan (see below for more, or read his articles here and here). One of my research interests is studying the role that humans and climate play in determining the spatiotemporal patterns of fire activity.hobart-tasmania-ian-stewart-oct-2006 Five years ago, I wouldn’t have imagined that this research problem would be so difficult to formulate and tackle in an incremental way. My qualitative assessment is that there are some very subtle differences (and therefore difficult to disentangle) between both humans and climate as driving forces in pyrogeography. The subtlety is hard to manage because (I think) that we innately believe that humans and fire are related. Surely, that innate belief should emerge burning-sugar-cane in some form from an examination of the appropriate data, right?? My first realization that this was a challenging problem was when I was working on designing a global fire model. Humans – specifically the burning of cropland and pasture – were not following the “rules”. The physical conditions best suited to a fire often did not line up with the patterns of fire. We wrote a paper for Biogeosciences that touched on these ideas (PDF), and we’ll present updates at AGU (PDF of Abstract). How do we address this problem? I have been working with paleofire scientists (for an example of that work, read a recent Quaternary Science Review paper by Dr. Jenn Marlon (a scientist at Yale U.) and colleagues here: PDF) and my colleagues and I are working on getting a handle on defining roles and research.

In the meantime, I also invited an ecological anthropologist named Dr. Michael Coughlan to speak in our department Speaker Series. Michael and I met briefly at a fire workshop a few years ago (PDF of meeting report). He has a few recent publications that help push at, or at least explore, the boundaries of disciplinarity in fire research that we gravitate towards because of our respective intellectual training (“do what you do best”). The first publication is about linking humans and fire through what Michael and his co-author call a transdisciplinary approach (PDF of that article). In that paper, the authors argue the following:

We argue that all extant fire regimes, in a sense, are anthropogenic and understandings of human agency, knowledge and the history of social systems are essential for characterising contemporary and historical fire ecology

Whenever you see the word “all”, you know the authors are about to say something that probably will be met with skepticism! But Coughlan and Petty support their thesis with case studies (evidence) and the fact that fire research – like my own – seeks out functional dependencies of fire on amazon-deforestation-greenpeacerelatively-easy-to-define physical variables (like population, temperature) rather than framing the problem in a more social/human context. Humans, in essence, use fire for cultural and practical reasons that may be related to the landscape they are in. Fire modeling certainly does not explicitly account for this human-landscape connection.

Another paper Michael published is in a journal I have never picked up before called the Journal of Ethnobiology (speaks to the massive interdisciplinarity needed to study fires, I guess!). The article is at this link as a PDF. In here, he presents the concept of “landscape memory” and how this relates to fire. This derives from the field work he did for his PhD in the Pyranees.

So, this Friday (Nov 15 2013), Dr Coughlan will talk about “Fire Use, Human Institutions, and Landscape: Ecology of an Agropastoral Fire Regime in the French Pyrenees” which derives from his recently-completed PhD research. I posted the following text to the CLAS-Exchange posting board:

Dr. Michael Coughlan will speak on “Ecology of an Agropastoral Fire Regime in the French Pyrenees” on November 15, 2013 at noon in McEniry 116.

Coughlan is a postdoctoral research associate at the University of Georgia Athens in the Department of Anthropology. His research interests include historical ecology, economic anthropology, environmental justice, and emerging trans-disciplinary socioecological systems approaches.

He is currently focused on researching the links between fire ecology, agro-pastoral livelihoods, and cultural landscapes, and is interested in integrating ethnographic, archaeological, geospatial, and paleoecological theory and methods. From an applied perspective, Coughlan is interested in contributing to conservation strategies that promote both cultural and ecological diversity and sustainability. Coughlan will present the seminar as part of the Geography and Earth Sciences Department Speaker Series, and he will be hosted by GES faculty member Brian Magi. More information on Coughlan is available on his website.

Please join us.

Posted in Earth System Observer | Tagged , , , , | Comments Off on Human and climate connections with fire activity

Charlotte Citizens Hearing on EPA Proposal to Regulate Carbon Emissions

Real conversations about how we can act on climate change (#ActOnClimate) seem to be happening right now. Environment North Carolina published their tabulated emissions from state power plants, and even highlighted North Carolina’s role in this.ghg-largeTo offer public support for the EPA proposal to limit carbon emissions from any new power plant, Clean Air Carolina and NC Conservation Network are hosting a Citizens’ Hearing in downtown Charlotte on Tuesday October 15 from 6-7:30pm (more info below). Charlotte Observer noted the event, and the general public is invited to participate. I will attend and offer brief remarks about the climate science behind the EPA proposal. Please join us and support the proposal to FINALLY regulate some of the emissions from any new power plants. This discussion will set the stage for the presumably upcoming/inevitable proposal to regulate emissions from existing power plants the EPA should have ready next year. From the Clean Air Carolina post:

Last week, the Environmental Protection Agency (EPA) announced its first steps under President Obama’s Climate Action Plan to reduce carbon pollution from power plants. The EPA will soon hold hearings in various cities at which the public can comment.

For decades, public participation has become a regular and important part of how new laws are carried out. As an alternative to attending an official EPA hearing, communities across the country will hold “Citizens’ Hearings” and all comments will be recorded and sent to the agency as official public record. Clean Air Carolina and NC Conservation Network are hosting the Charlotte Citizens’ Hearing on Tuesday, October 15 to allow area residents the opportunity to provide oral testimony on the new rule.

Charlotte Citizens’ Hearing
October 15, 2013 – 6:00 p.m. – 7:30 p.m.
Caldwell Presbyterian Memorial Church
1609 East 5th Street
Charlotte, NC 28204
RSVP today and let us know you’re coming!

Cleaning up power plant pollution will result in better air quality, healthier communities and a major reduction in climate changing pollution. Just today, the world’s top climate experts have announced an upper limit on carbon emissions that they warn we cannot pass if we are to avoid the most dangerous effects of a warming planet. Join us for the Charlotte Citizens’ Hearing to show your support for strong carbon rules on new and existing power plants! See below for Citizens’ Hearings scheduled in other NC cities.

Posted in Earth System Observer | Tagged , , , , , | Comments Off on Charlotte Citizens Hearing on EPA Proposal to Regulate Carbon Emissions

Tracking and targetting emissions from power plants

Speaking as a part of a press release about power plant carbon emissions in NC.

Speaking as a part of a press release about power plant carbon emissions in NC.

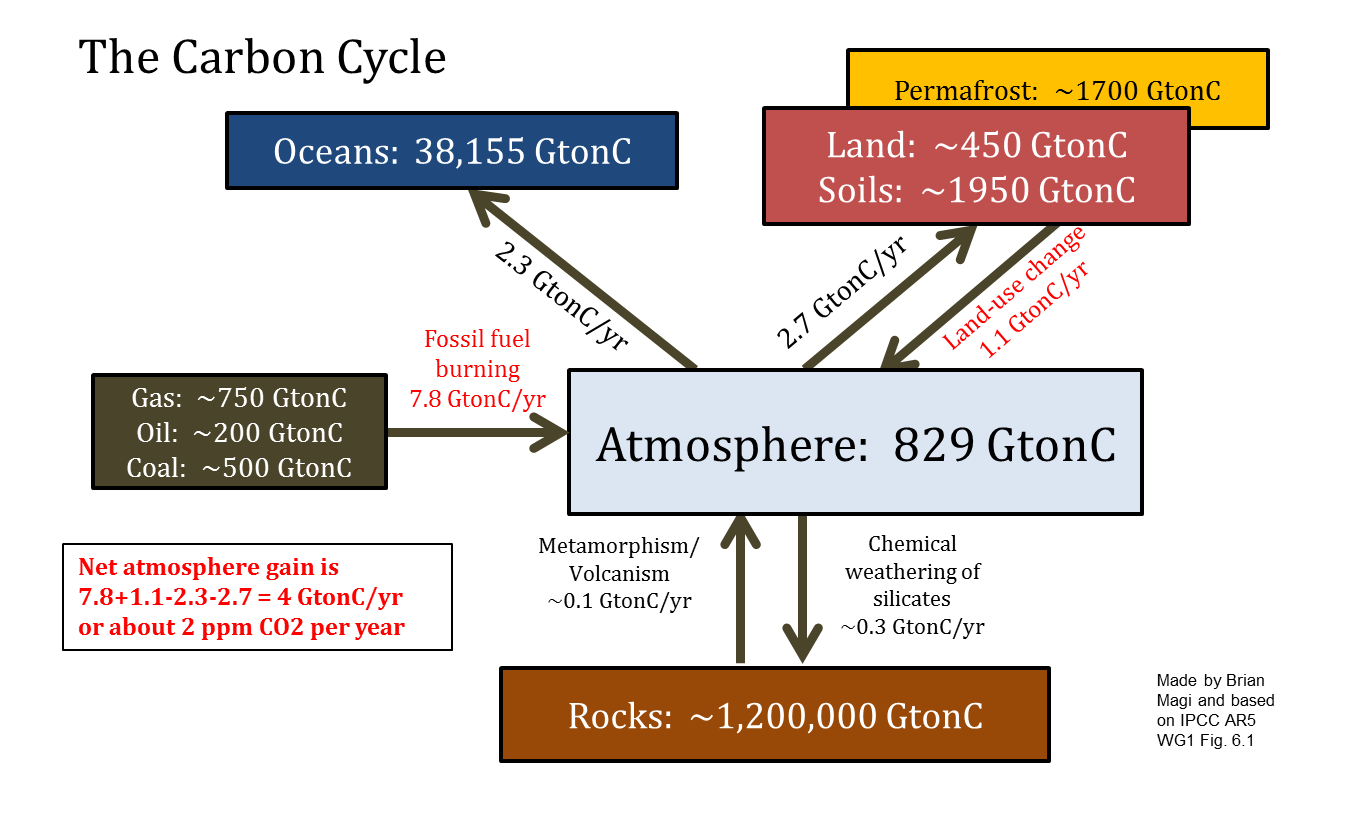
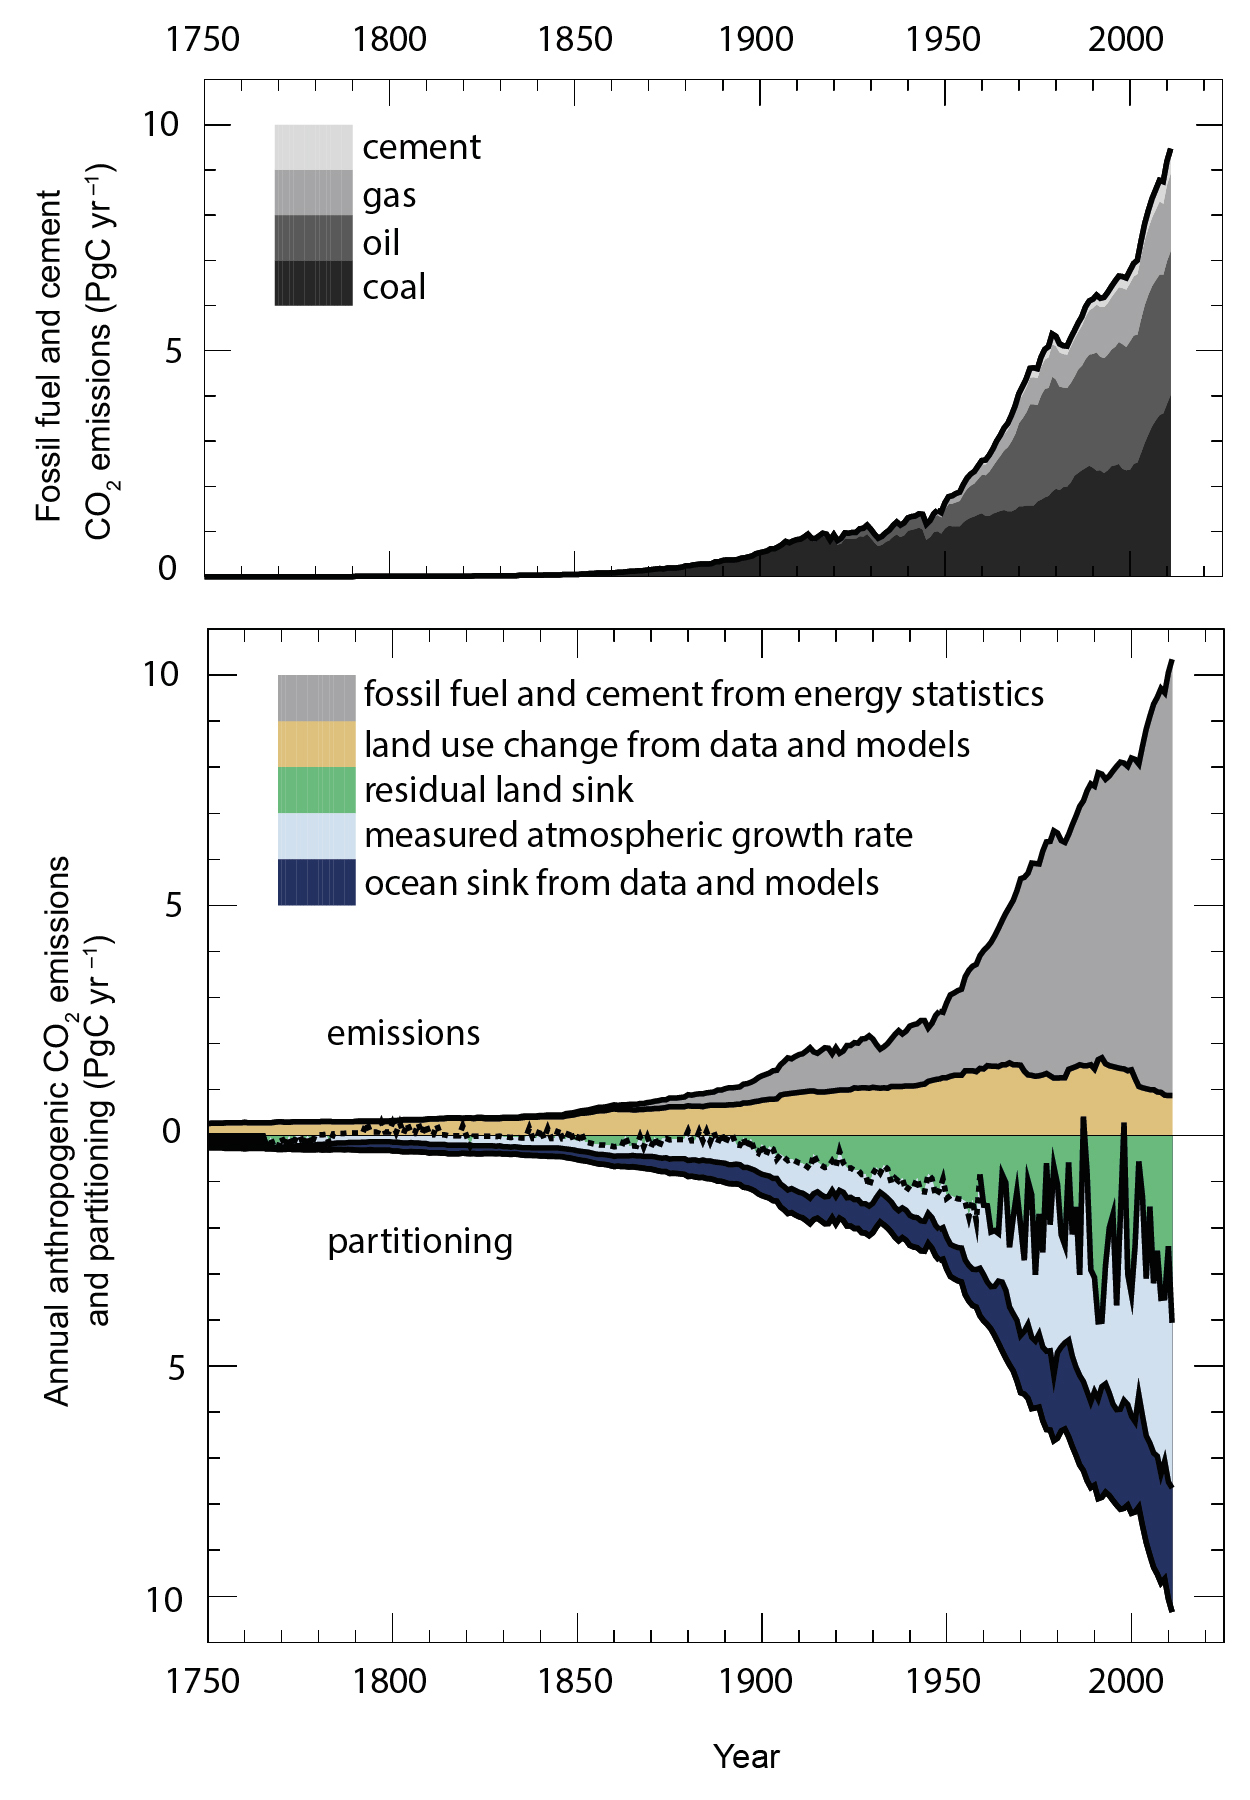
As my students probably know by now, I think an important point when discussing or even thinking about how to deal with the combination of our hunger for energy and global warming is to remember the scales of the problem. There are two important scales to consider in every discussion of global warming: time and space. The adjectival forms would be “temporal” and “spatial”. The super-cool adjective, which I probably overuse, is “spatiotemporal”. Spatiotemporal analysis is critical to understanding global warming and what it means in any single location on Earth. The temporal scale is highlighted over and over again right now because of the global warming “pause”, which as any analysis or background research should reveal, is nothing more than a pause and that plenty of research is underway and done that helps to understand yet another small surprise in the complex Earth system. One part of the problem of climate change that is not surprising is what is the cause. Carbon emissions from fossil fuel burning are the main culprit, so the prescription is simple: Stop burning fossil fuels. Hah! This comes back to our hunger for the energy stored deep in the Earth, so the answer is definitely not as simple as the prescription.

Me talking about the state of climate science with Graham Givens of Environment NC, Ronald Ross, local resident and Vice President of Stewart Creek Environmental Association, and reporters!

Me talking about the state of climate science with Graham Givens of Environment NC, Ronald Ross, local resident and Vice President of Stewart Creek Environmental Association, and reporters!

I provided some scientific feedback to an effort by Environment North Carolina a few weeks ago that I neglected to highlight on my research webpage (but I did on twitter), and I will expand on this a little now. Environment NC released a report of carbon emissions from power plants across the USA. Power plants (coal, natural gas) are required to track and report these emissions, so sometimes groups just need to put forth the effort in assembling these numbers into a coherent piece of writing, which is what Environment NC did. They found that 3 of the top 50 most serious carbon emitters were in the state of NC – they are all coal plants of course. Coal is still being burned even though Natural Gas is used more and more. The key findings, as Environment NC stated on their written press release, are:

  • The Marshall plant, near Lake Norman, emitted 10.1 million metric tons of pollution in 2011, the equivalent of 2.09 million cars.
  • Three of the most polluting power plants in the country are in North Carolina: Belews, Roxboro, and Marshall.
  • Belews Creek Power plant near Winston-Salem was the state’s biggest global warming polluter and 16th overall, emitting 13.8 million metric tons of carbon pollution, the equivalent of 2.9 million cars.
  • North Carolina’s power plants are the 12th most polluting in the country, producing as much carbon each year as 15 million cars.
  • North Carolina’s power plants are its single largest source of carbon pollution – responsible for 51% of the carbon pollution in the state.
  • The press release was at their news site, and they arranged a live release for media. I went to Frazier Park near the heart of the Queen City early in Septemeber to speak about the science, essentially relying on the discussion in IPCC AR4, which is what I discuss in my classes too. I spoke from the position of scientific evidence. The press release at Frazier Park made its way through state and city news outlets, and I thought the reporters did a great job with the write-ups. Here are some links:

    Charlotte Business Journal

    WSOC-TV in Charlotte

    NC Public News Service

    Charlotte Observer

    I think on the eve of the release of the first part of the IPCC Fifth Assessment Report, it’s important to remember that the solution to the problem of global warming, or at least the best way to mitigate the problems, begins at a local level. We have to remember that the carbon emissions in our backyard – which Environment NC highlighted – affect the entire world. CO2 lasts 100-1000 years in the atmosphere so CO2 from North Carolina will be absorbing infrared radiation for a long, long time. Maybe I’ll write an op-ed for the Observer.

    Posted in Earth System Observer | Tagged , , , | Comments Off on Tracking and targetting emissions from power plants

    Undergraduate students scouring internet for global warming articles

    I’m teaching my Global Environmental Change this semester and the students have been busy reading and putting together response papers to the readings. This past week, I asked the students to find a news article published in 2013 about climate change. Not a hard search really, but I also asked them to evaluate or talk about how they evaluated the expertise of the author of the article. Many of the articles below give a glimpse into what students are thinking about with climate change. Here is the list:

    Hurricanes striking coast could decrease with global warming
    Cooling Pacific dampened global warming
    Summary of IPCC AR5 panel findings
    Pacific allies in fight against climate change
    Climate change policies in Europe and adverse impacts on African agriculture
    Is global warming slowing down?
    An advocacy piece centered on Hardball interview with Professor Michael Mann and a Republican strategist
    Climate sticker shock related to Arctic melt
    Record temperature in Greenland
    Germany’s energy outlook
    Gulf Stream slowdown linked to faster rate of sea level rise on USA East Coast
    Climate change impacts on the energy infrastructure
    Global warming primer
    MTV rocks the POTUS SOTU 2013 party
    Carbon farms reversing global warming
    Pause in global warming should not translate to pause in action

    Posted in Earth System Observer | Tagged , , | Comments Off on Undergraduate students scouring internet for global warming articles

    Ramping up for teaching with NOAA NCDC

    Summer is a time of dedicated research for me. Finished one project, waiting for peer reviews on that manuscript, tinkering with twitter, planning out research conference travel in the next school year, and working on a grant proposal to NSF. The season of the classroom is nearly here though, so I’m slowly re-allocating my hours to teaching. A great early-career workshop for university and college faculty that I attended the last week of July helped me get into gear with teaching again. I need a workshop like that every summer!

    Another way I start to think about teaching is to begin to browse through the data that I want to bring into the classroom. One site I haven’t visited in months, but that I prolifically visit throughout past school years, is the NOAA NCDC time series plotter. I had the pleasure of visiting the numbers again tonight and remain very impressed by NCDC outreach and transparency efforts. The new addition to the time-series plotter (which you can use to produce climate-relevant analysis at different spatial and temporal scales) is a slightly more friendly user-interface, and a few features that I think most stats people will really appreciate. Yes, it’s not a super fancy analysis package, but the statistical analysis you can do just via the webpage now includes two new options. One is the option to display the anomaly against a different base period rather than always using the 20th Century average. In other words, you can choose a base period of 1951-1980 like NASA GISS tends to use or you can play around and see what the effect of a different base period is. The other new option is a display of a trend line for any period. The first thing you can do with this is see how temperature (for example) trends in the early part of the century compare to the trends in the latter part of the century. Or you can mimic the cherry picking that climate data is sometimes a victim to and choose very specific start and end points to produce a trend that amplifies an argument you are making (“look, it’s getting colder!” or “look, it heating up super fast”). one exception to all this great online analysis is that it only applies at the “super” level for data in the contiguous USA. someday, i’ll ask NCDC scientists why this can’t be done for Alaska and Hawaii, and why the global analysis tools are more limited. either way, an exciting development in my virtual friendship with NOAA NCDC.

    Posted in Earth System Observer | Tagged , , , , , , | Comments Off on Ramping up for teaching with NOAA NCDC

    Life expectancy reductions in the polluted air of China

    Shockingly little has been published in the peer-reviewed literature about the air pollution in China, although there has been plenty of press coverage. I talked a little bit about the US Embassy twitter data and how fires polluted the air over Beijing*. The health impacts of the exposure of humans to sustained levels of unhealthy or hazardous air pollution levels is widely expected to increase mortality rates due to cardiorespiratory failure and increased instances of cancer. The question then is raised: What hard evidence exists that proves this hypothesis? Modeling studies seemed like they would have to suffice. Until now.

    Researchers from China, Israel, and the USA just published what I would call a very important study that concludes that elevated particle pollution in Northern China compared to Southern China has reduced life expectancy by 5.5 years. They took advantage of a dataset that emerged as a result of a Chinese policy employed from 1950-1980 that provided free coal for heating for everyone living north of the Huai River that runs right through the center of China and shown as the black line in the figure below.

    This is Figure 1 from the Chen et al. (2013) study published in PNAS.  The PDF of their work is available for free - open access - by clicking on the figure.  The annotation is my own summary of the key finding.

    This is Figure 1 from the Chen et al. (2013) study published in PNAS. The PDF of their work is available for free by clicking on the figure. The annotation is my own summary of the key finding.

    What they found was that particle pollution concentrations were 55% higher in Northern China due to the availability of free coal. This strong and significant difference between the north and south as a result of the Huai River policy (as the researchers call it) set up an experimental control scenario on a large enough scale (population wise) that the statistics were robust. The statistical model combined the particle concentration difference with proximity to the Huai River, detailed mortality statistics from a program in China called the Disease Surveillance Points (DSPs), and a number of other possible factors that may influence mortality to prove with high confidence that their results were robust. The life expectancy of the Chinese citizens north of the Huai River (which includes Beijing, Lanzhou, and Xian) is on average 5.5 years less than those of citizens living south of the Huai River. The decrease in life expectancy, the research shows, was almost entirely attributable to the 55% increase in particle pollution concentrations. The paper is worth reading, especially given the current state of Chinese air quality referred to above.

    *I mentioned the effect of smoke from agricultural fires on Beijing particulate matter (PM2.5) concentrations, and there has been a lot of internet discussion of the US Embassy twitter feeds documenting PM2.5 concentrations in now 5 major urban centers of China that are geographically distributed from Shenyang in the Northeast to Beijing and Shanghai in the East, and Chengdu in central China, and finally in the south in the city of Guangzhou which is north of Hong Kong. PM2.5 refers to the mass concentration of particles with diameters less than 2.5 micrometers or 0.0000025 meters and is without a doubt the most devastating form of particulate matter air pollution for the human body. This stems from the simple idea that smaller particles can be inhaled more deeply into the respiratory system. Smaller? Smaller than what? Well, other categories of PM also exist. PM10 refers to mass concentrations of particles with diameters less than 10 micrometers, or 10 millionths of a meter or 0.000010 meters. Still very small. Then there is the less precise category of total suspended particles (TSP) which presumbably includes some fraction of particles greater than 10 micrometers in diameter while also including the mass of the smaller particles. Typically, PM10 and TSP are closely related because particles larger than 10 micrometers tend to fall out of the atmosphere much more quickly. Regardless of the PM (PM2.5, PM10, TSP), they are all bad.

    Posted in Earth System Observer | Tagged , , | Comments Off on Life expectancy reductions in the polluted air of China

    Earth observations gallery

    I used to really like photography. A big chunk of my senior year in high school and freshman year in college were spent in a dark room experimenting with developing processes and photograph creation. Film cameras are a thing of the past essentially (although I still have my Nikon and old photo gear that was woefully incompatible with the new Digital SLR bodies), but imagery is not. Data visualization is a huge force on the web, and imagery is constantly thrown our way from the more traditional camera and from cameras in space. The exploratory power of all this information is staggering (one example here). All that being said, I think it’s important to step back and just view some of the imagery emerging from these sources. I don’t have webpage links for these, and I’ve enhanced contrast and color in some cases but take a look. Which evokes the most visceral sense that you are connected to a global community? Data, nature, both?


    The images are all cropped to an aspect ratio of 16:9 or HDTV. Let me know if you want more information about the photos/images.

    Posted in Earth System Observer | Tagged , | Comments Off on Earth observations gallery

    Activity on twitter

    I haven’t posted anything here for about a week – an eternity in the land of constant chatter (the internet). I’m working on a couple of publications, which take a lot of concentration, so that’s my main excuse. My secondary excuse is that I’ve been prowling around the twitter-verse. Science talk on twitter has been active! Hard to quantify, but just seeing how much many prominent climate scientists (defined by publications, say), advocates, and climate-related groups are posting makes me think that some of discussion that twitter is a good venue for quickly disseminating science are on the right track. Facebook always felt stilted to me and seemed more like something you do with friends and family then the general world. Twitter feels different, but like I said, it’s hard to quantify. The best hashtag I’ve been witness to has been #ActOnClimate in response to President Obama’s speech announcing his administration’s Climate Action Plan (PDF with more details) and also since then. #ActOnClimate was trending high all afternoon on the day of his speech, for example. So my recent posts have been at the level of tweets and that’s about it. Here is a snippet of my activity.

    Science, global warming, and education news:

    Dynamics of a still mysterious part of the Earth that is above sea level (of course the oceans have many more mysteries!):

    Back to my roots with aerosol research and the myriad of dampening effects these little particles have on phenomena:

    Are eating habits going to be forced to change? I’m not 100% convinced of this, but I am 100% worried if climate science suggests that hamburgers have to go!

    go to @brianmagi for more. If you have your own climate action plan going in the Charlotte area, I’d love to hear from you on twitter or email.

    Posted in Earth System Observer | Tagged , , | Comments Off on Activity on twitter