Where the seasons align
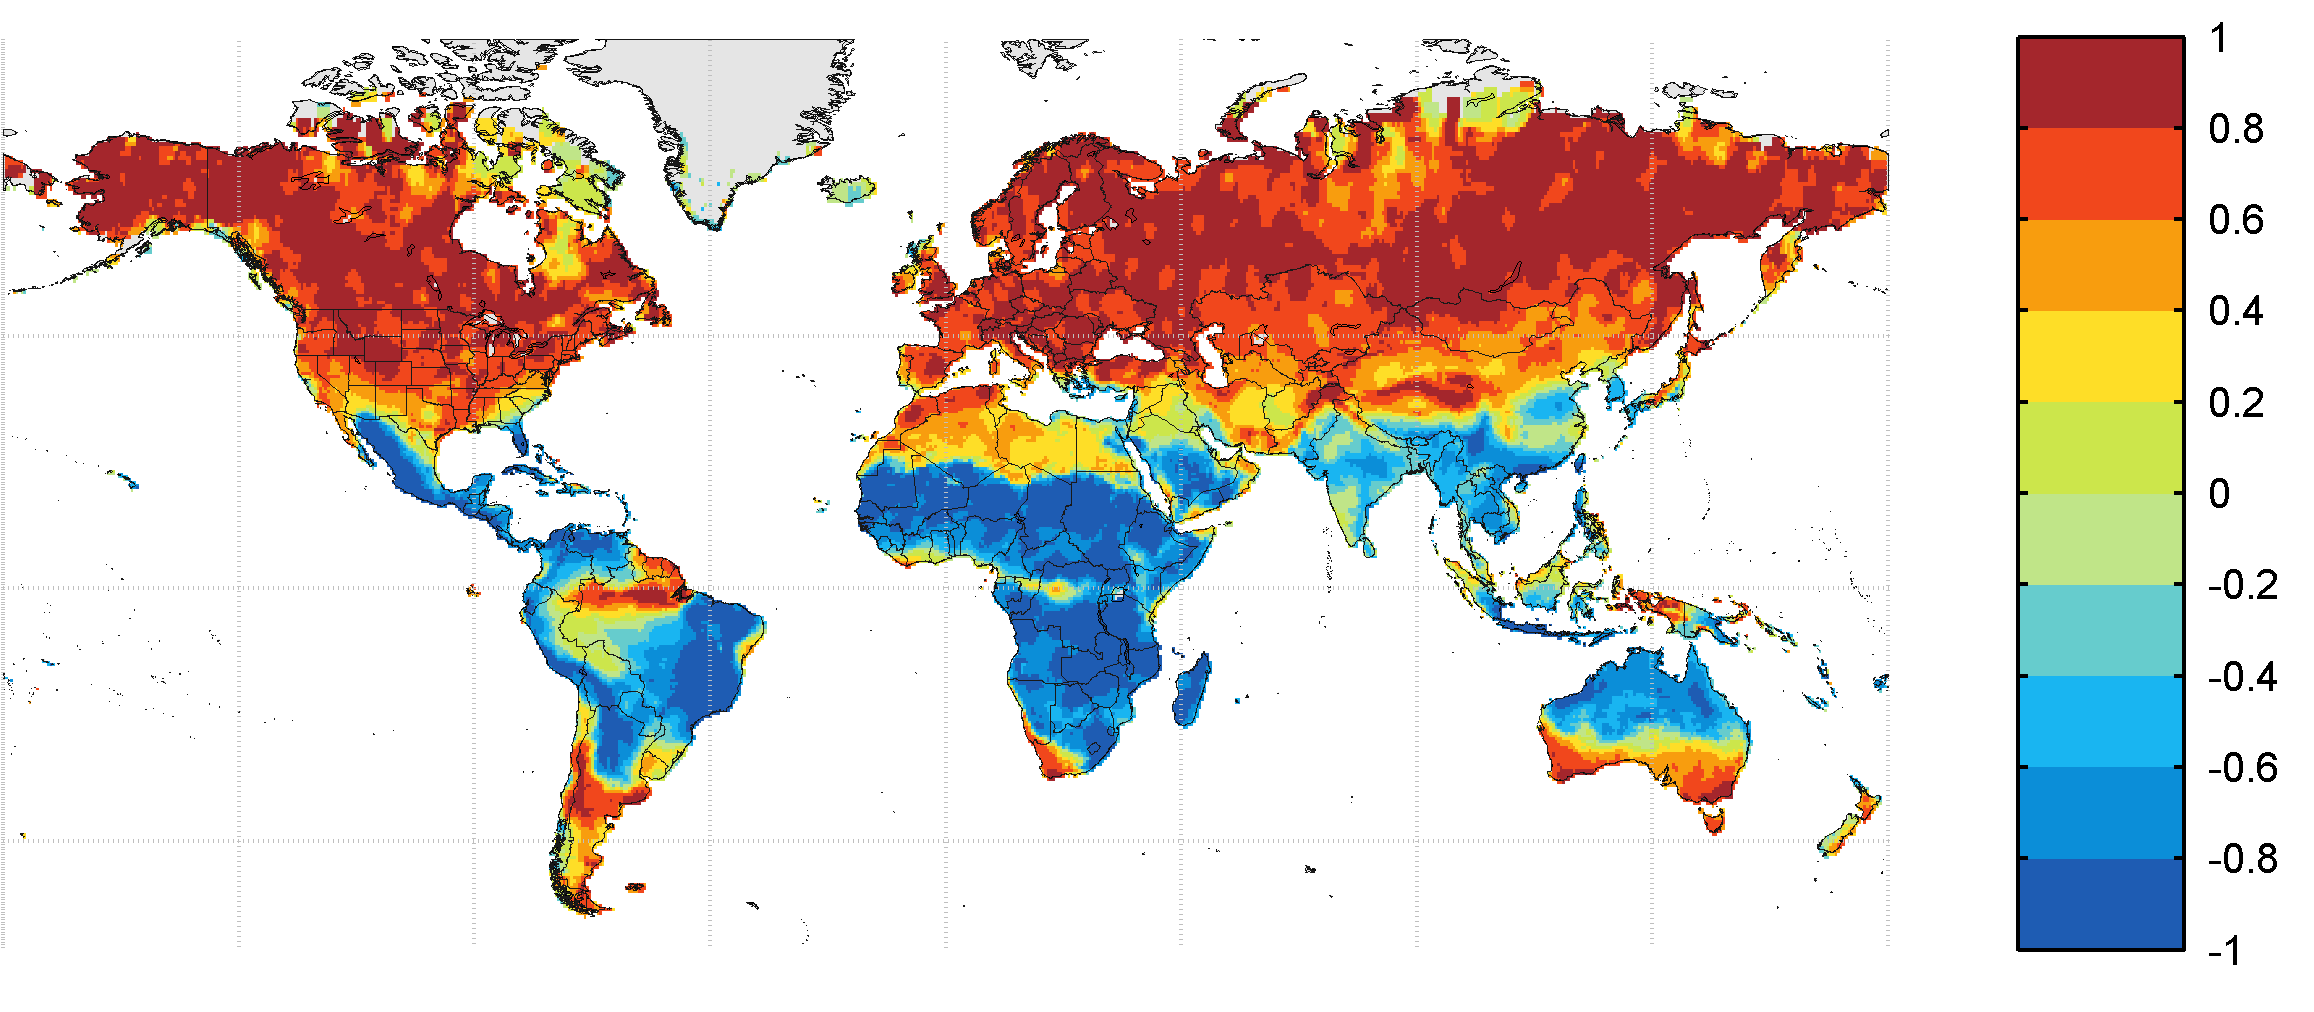
Fires and lightning! I have been working on questions related to these high energy Earth system phenomena for a long time. Our planet has something like 3 million fires each year. Lightning flashes about 250 million times each year, and yet only accounts for about 10% of all those fires. The rest are set by humans. The map to the left shows where in the world seasonal lightning and flammability conditions are correlated – red means that the lightning season lines up with the most climatologically flammable part of the year (generally the dry season in the tropics, hot season in the rest of the world). Blue means the seasons are out of phase with each other and suggests that lightning-driven fires are less likely.
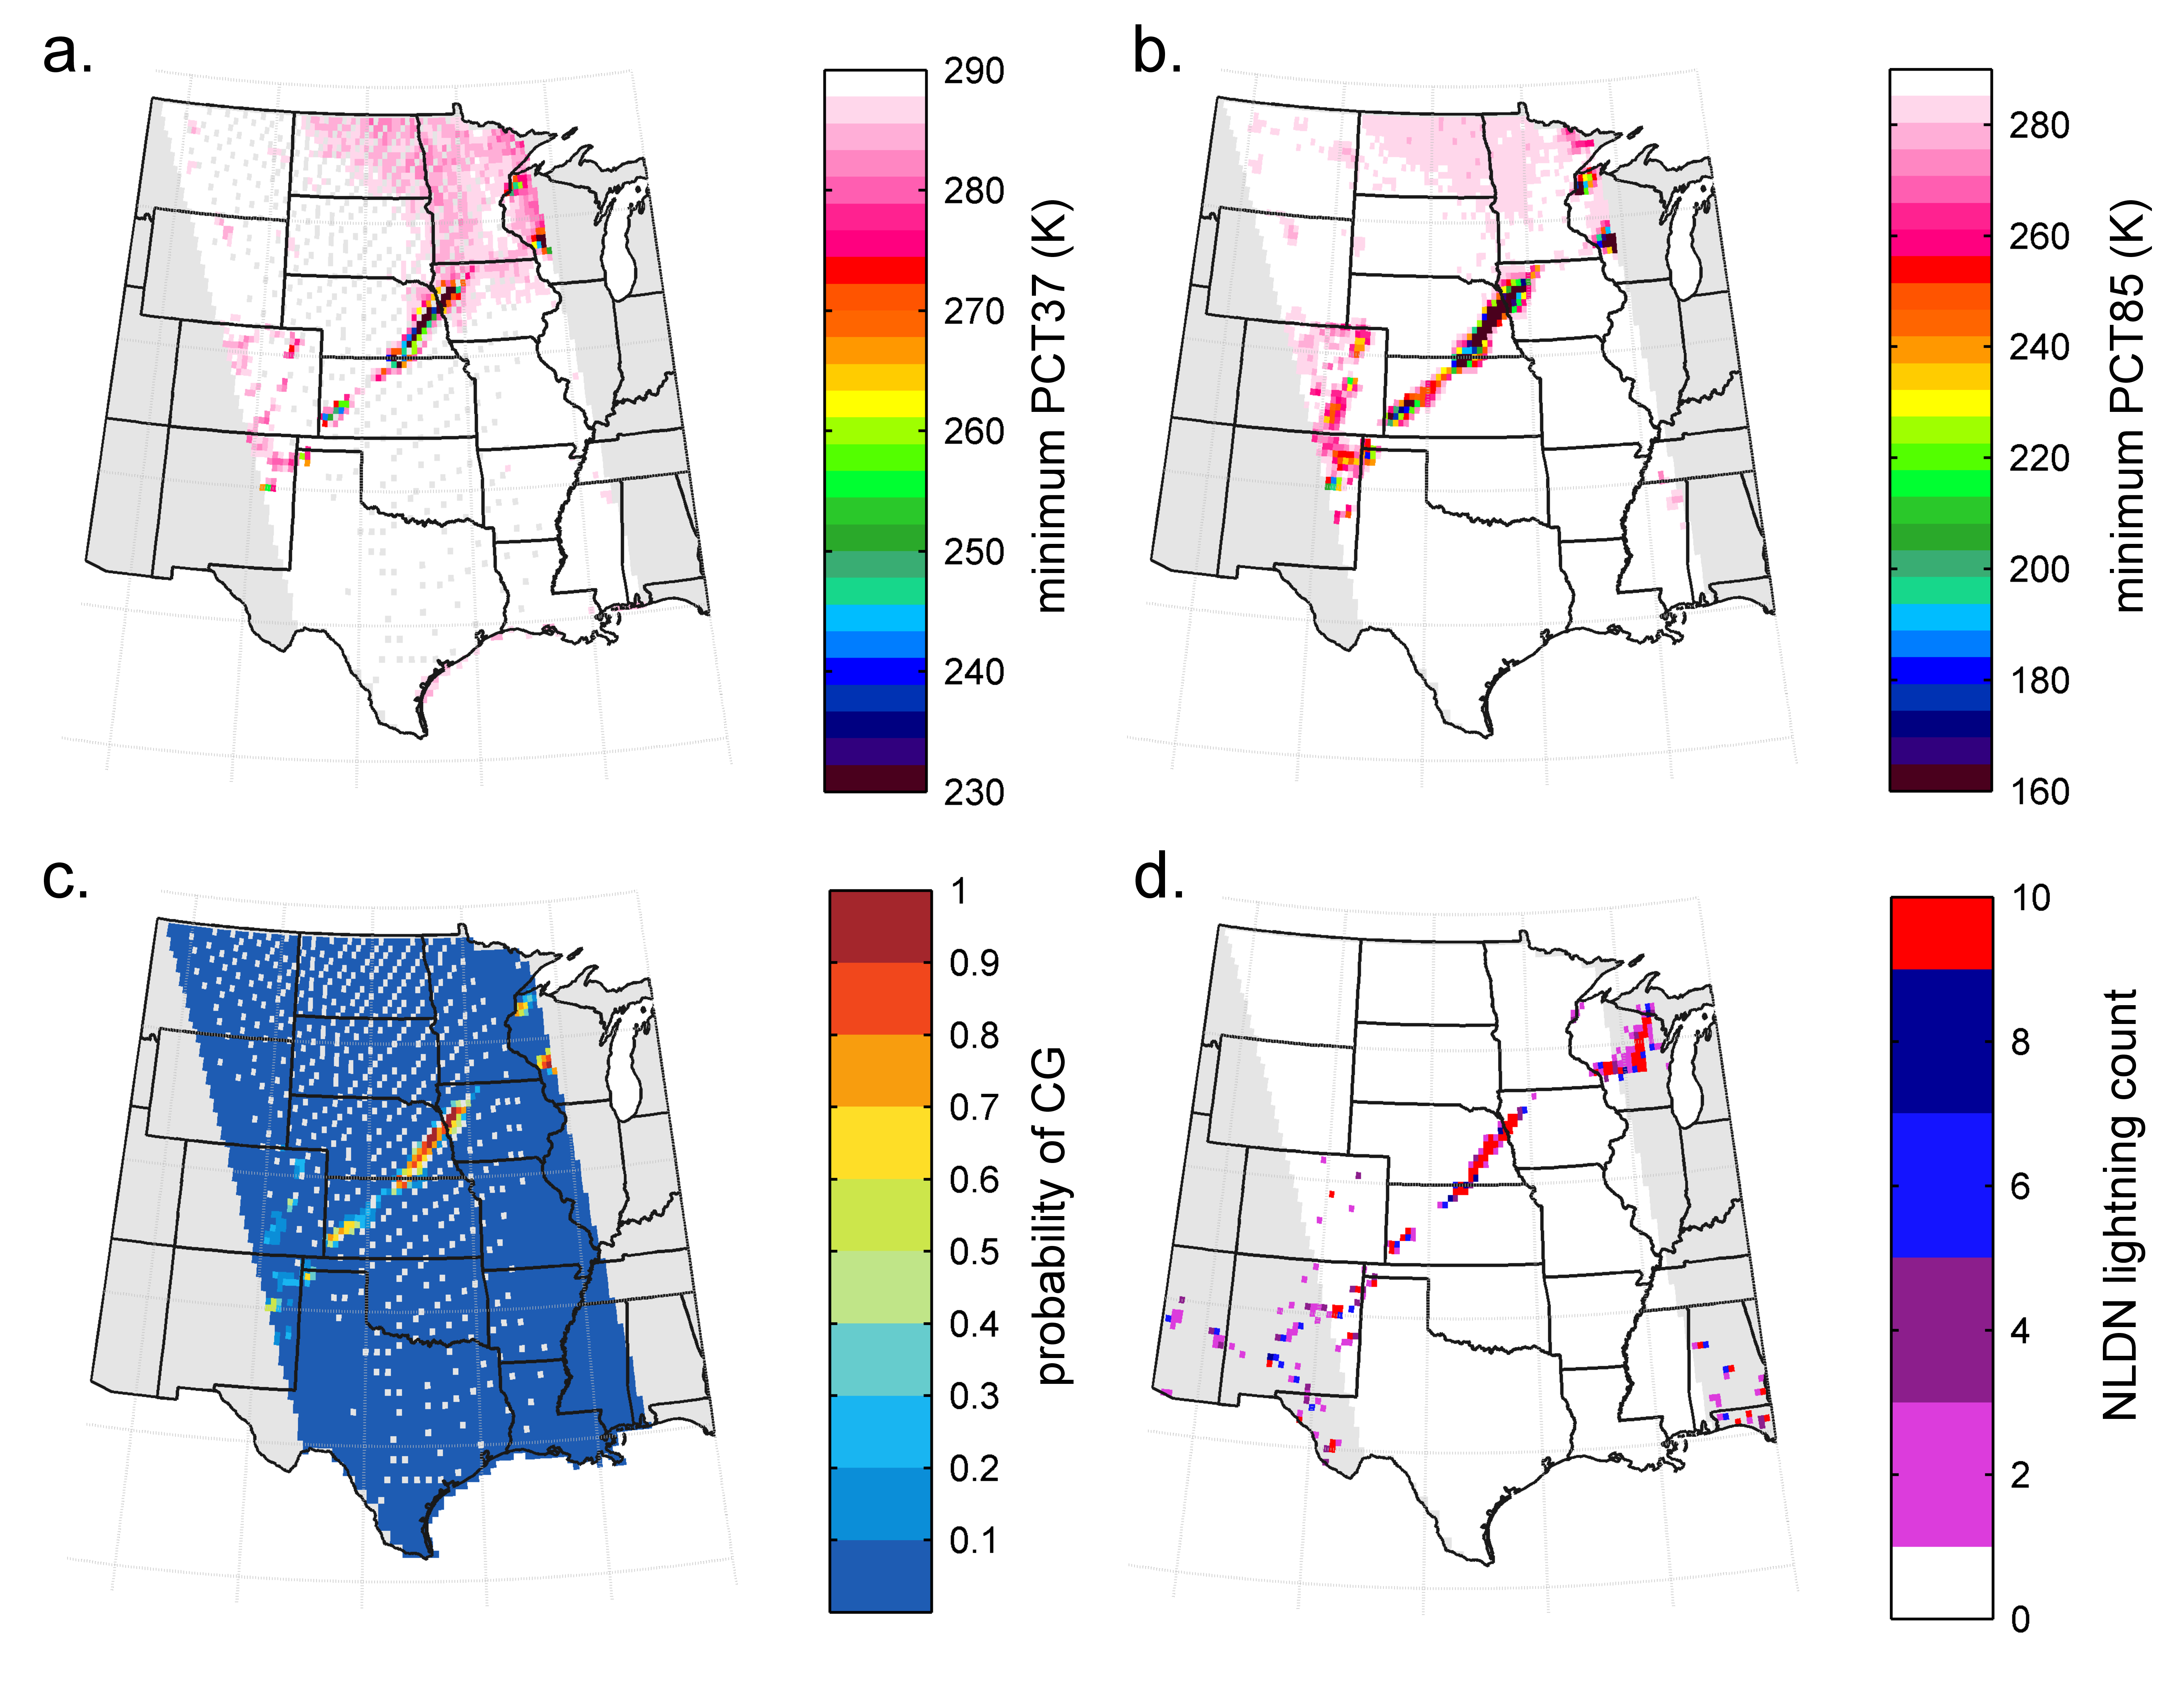
Microwave remote sensing data from SSMI and lightning from NLDN
To understand the interconnections of fires with lightning, climate, and humans is a really challenging problem. One way I work on this is using satellite data to learn more about recent lightning variability from unusual sources. Another way is to borrow climate model output to find a good proxy for lightning. Yet another way is to take anthropological data about fire practices and work with spatial patterns. We still haven’t figured the interconnections out perfectly yet. See below for an attempt to draw out lightning from microwave remote sensing data. If we get this to work, we could extend lightning data back another 15-20 years.
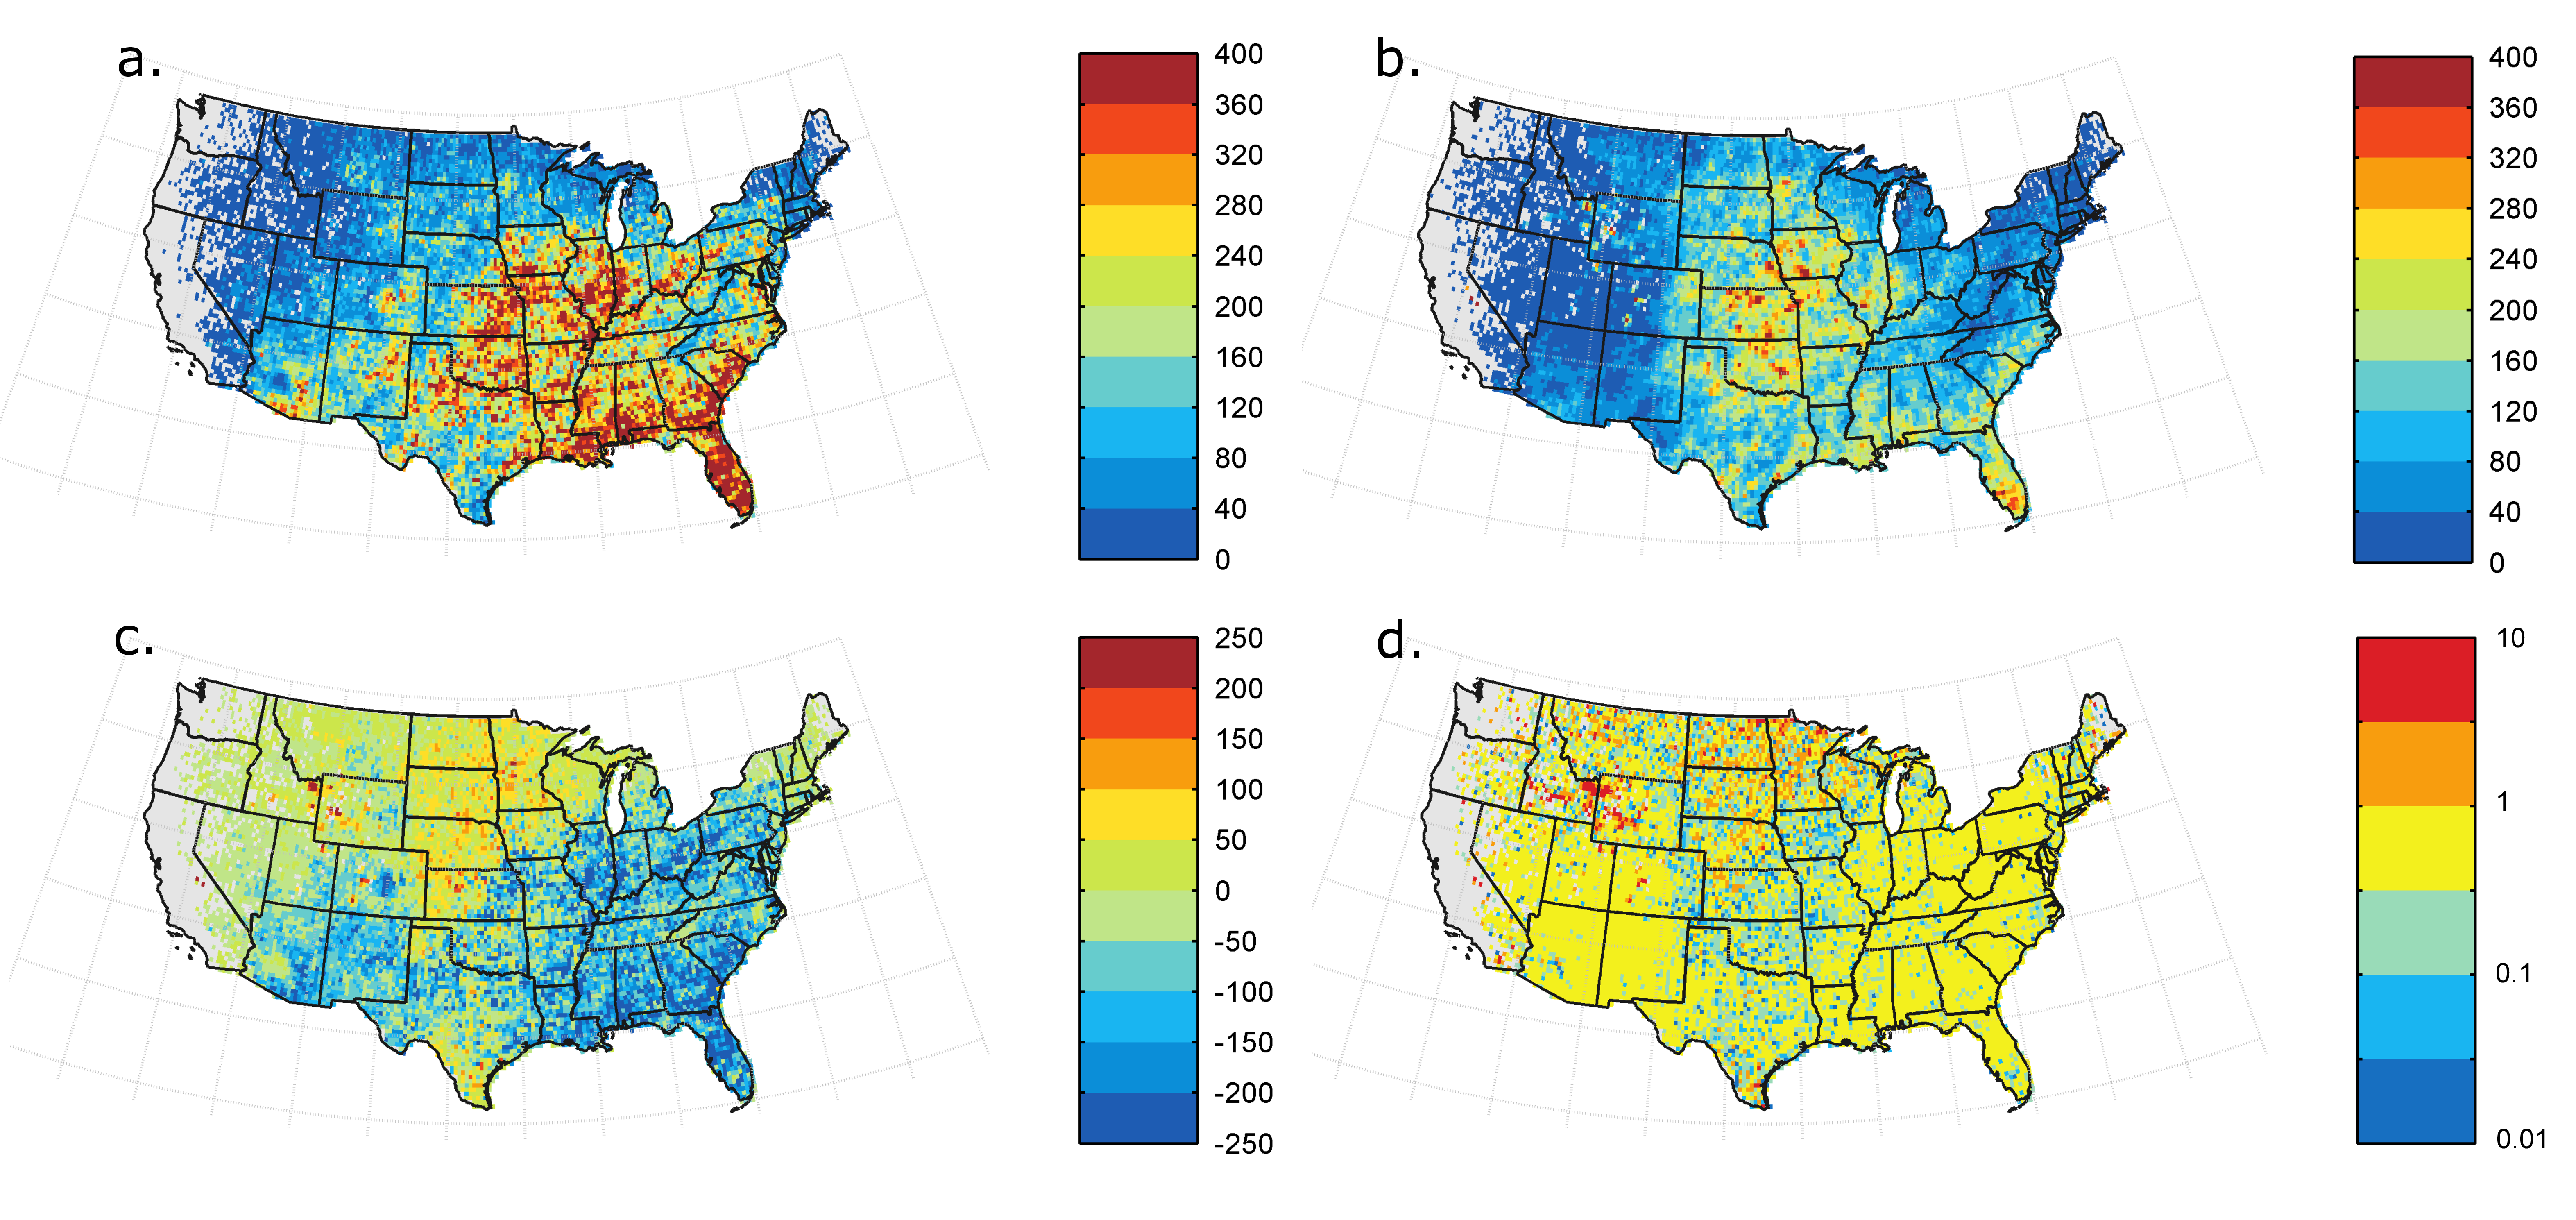
USA lightning from (a.) NLDN, (b.) SSMI, and shown as a (c.) Difference, and (d.) Percent difference