On Thursday, May 16, 2013, the official daily-averaged CO2 concentration in the atmosphere was reported by Scripps as (drumroll please) Like I pointed out, 400 ppm is inevitable because CO2 increases by 2 ppm every year, but to actually see a value like that reported makes it more real. Now we await a value that is over 400 ppm for an entire week, and then for a month, and then it’s just a matter of time when we are in a world with 400 ppm of CO2, remembering how different this is than any time in Earth’s recent history as shown in the figure to the right (click to make larger).
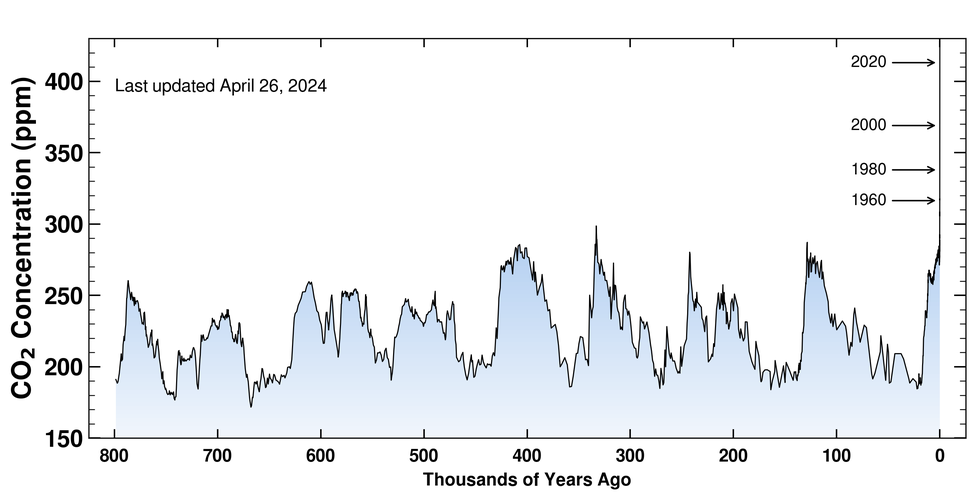 Remember that CO2 in the atmosphere is a pretty simple physical perturbation on the Earth’s energy budget – more CO2 will result in an atmosphere that absorbs more of the infrared energy that the Earth emits to space to try and cool off. The energy that does not escape and is absorbed is then re-emitted towards the surface (and towards space). This forces the Earth to warm in response to try to bring the energy budget back into balance since balance is inevitably what everything in the universe seeks to achieve. This forcing of the Earth’s temperature has never been in doubt. The real question is how the Earth SYSTEM will respond to the extra energy or extra warmth. The SYSTEM is something I will start talking about here and it is certainly the most complicated aspect of climate science. Imagine the complexities associated with trying to understand how the atmosphere, ocean, land and plants, ice, and even humans and animals will all respond and how each affects the other! That is the heart of Earth system science and the heart of the very current discussion about climate sensitivity – a measure of how the system in total will respond to perturbations like more CO2 in the atmosphere. A very nice op-ed in the New York Times by Justin Gillis this week highlights the frank evaluation and debate about climate sensitivity occurring in the scientific community that has arisen from the apparent slowdown in the increase in globally averaged temperature (since about 2002 in the GISS time series or slightly more evident in the NCDC time series below)
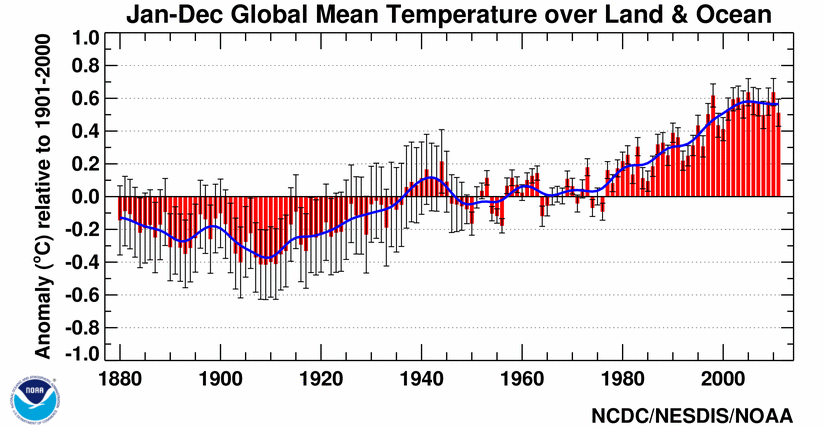 The issue is getting a load of attention and, as Gillis wisely acknowledges, the analysis and studies in the peer-reviewed scientific literature will take a couple of years to “settle” on an answer. I agree. The public and policy makers and just about everyone wants to know the answer though so every publication or even statement about climate sensitivity will be intensely amplified. I’ve been reading about this issue myself, mostly as I prepare to bring the very current discussion into the classroom (here, here), but also because I am as concerned about the Earth as anyone. Here’s a final statement by Gillis that I also agree with.
Even if climate sensitivity turns out to be on the low end of the range, total emissions may wind up being so excessive as to drive the earth toward dangerous temperature increases. So if the recent science stands up to critical examination, it could indeed turn into a ray of hope — but only if it is then followed by a broad new push to get the combustion of fossil fuels under control.
Regardless of the climate sensitivity, changes to our lifestyles are inevitable. Will our society and will the USA be seen as forward-thinking or will we revert to the simplest and most destructive way to get energy?