twitter

Activity on twitter

I haven’t posted anything here for about a week – an eternity in the land of constant chatter (the internet). I’m working on a couple of publications, which take a lot of concentration, so that’s my main excuse. My secondary excuse is that I’ve been prowling around the twitter-verse. Science talk on twitter has been active! Hard to quantify, but just seeing how much many prominent climate scientists (defined by publications, say), advocates, and climate-related groups are posting makes me think that some of discussion that twitter is a good venue for quickly disseminating science are on the right track. Facebook always felt stilted to me and seemed more like something you do with friends and family then the general world. Twitter feels different, but like I said, it’s hard to quantify. The best hashtag I’ve been witness to has been #ActOnClimate in response to President Obama’s speech announcing his administration’s Climate Action Plan (PDF with more details) and also since then. #ActOnClimate was trending high all afternoon on the day of his speech, for example. So my recent posts have been at the level of tweets and that’s about it. Here is a snippet of my activity.

Science, global warming, and education news:

Dynamics of a still mysterious part of the Earth that is above sea level (of course the oceans have many more mysteries!):

Back to my roots with aerosol research and the myriad of dampening effects these little particles have on phenomena:

Are eating habits going to be forced to change? I’m not 100% convinced of this, but I am 100% worried if climate science suggests that hamburgers have to go!

go to @brianmagi for more. If you have your own climate action plan going in the Charlotte area, I’d love to hear from you on twitter or email.

Beijing air quality and agricultural fires

As I browsed through my favorite twitter feeds which includes @BeijingAir and the other US Embassies, I saw there was some really really poor air quality in Beijing. The US Embassies in China tweet particulate matter 2.5 (PM2.5) concentrations in the atmosphere on an hourly basis and also provide 24 hour average PM2.5 per the (USA) EPA regulatory methods. Namely, 24 hour PM2.5 is what’s regulated by the EPA in our country, and since US Embassies are US territory (as I understand it from The Simpsons Bart vs Australia episode), then US-relevant metrics are tweeted in addition to the hourly data. I tweeted about the very poor air quality in Beijing today

and

The second tweet was an tribute to an Onion article saying something like EPA tells people to stop breathing but I couldn’t find a link. Ok. So after I sent out that 2nd tweet, I began to wonder: What the heck is going on in Beijing? PM2.5 is above 400 ug/m3* for hours on end during the day and the 24 hour average PM2.5 just got tweeted as nearly 300 ug/m3. This is extremely hazardous, both on the EPA scale of Air Quality Index (AQI) and on the scale of I-Cannot-Breathe-Long-Enough-To-Finish-This-Sente… (no link to that scale). As the title of the post implies, the answer is related to burning practices – and I think it’s worth more that a couple of tweets. I’m asserting that the main problem is emissions from local/regional agricultural fires. This touches on my own research into fires and the peculiar human-influenced fire seasonality as a function of where you are in the world. Now, take it easy, I tell myself. Why? Every scientist loves to talk about science, but we especially love talking about our own research. I’ll try not to go on and on, is what I’m saying.

How can we do a first-order (read as “informal”) test of this hypothesis? First, let’s check satellites. There is some very accessible information from NASA that can be used to study problems that aren’t in the data-rich part of the world or in the parts of the world where I don’t even know what the characters are for “fire”. NASA has a satellite called Terra reporting data since November 2000. From this page, I googled the lat-lon of Beijing (40 N, 116 E) and created my own custom satellite image of Eastern China with the approximate location of Beijing marked.

Satellite image from MODIS sensor on the NASA Terra satellite for June 28 2013.  Beijing location is approximate.

Satellite image from MODIS sensor on the NASA Terra satellite for June 28 2013. Beijing location is approximate.

Right away, you see there are clouds. But there are also signs of gray-ish haze very similar to my research page header up at the top (smoke pouring off of southern Africa). So smoke is a distinct possibility. Now we can use data from the same NASA satellite (Terra) and same sensor (MODIS) but using a different wavelength of electromagnetic radiation. Namely, the parts that we feel/sense as heat – or thermal infrared radiation. Turns out, NASA has a whole team of scientists looking at this data and there is a data product called the Thermal Anomaly product. Something more “operational” (meaning it’s available at a semi-regular and rapidly updated way, like weather data is for weather forecasting models) for global fires is available at the same NASA website as I used to get the image above. Here’s the global view of fires
Global fire activity from the last 10 days ending on June 28 2013.

Global fire activity from the last 10 days ending on June 28 2013.

Clearly, fires are active in Eastern China – so we’re almost at the bottom of the mystery of why @BeijingAir is not the place for breathing deeply right now. You can download a map file showing fires from the last 48 hours for different regions by going to the KML tab and opening the KML file in Google Earth. I downloaded the “Russia and Asia” KML file and produced this
Active fires from the MODIS sensor on the NASA Terra for the 48 hours ending on June 28 2013.

Active fires from the MODIS sensor on the NASA Terra for the 48 hours ending on June 28 2013.

where you can see that my Google Earth has the Beijing Embassy location saved as a placemark. Regardless of the clouds, the pollution from the fires is certainly pouring into the atmosphere over Beijing and affecting surface air quality to the point that the AQI values are nearly off the scale again, but this time, it is not because of the combination of meteorology and emissions from fossil fuel consumption.

The winter and spring months – the months related to the very poor air quality referred to in the report above and here – are plagued by deep near surface temperature inversions that act to inhibit mixing. What does this mean? Well, if pollution is emitted from cars and factories in Beijing in the winter-spring, it will tend to stay in the first 500 meters (1800 ft) above the ground – roughly. The pollution gets trapped. On a day without a temperature inversion, the pollutants emitted are probably about the same, but mix into a much deeper atmosphere (say about 2000-3000 meters, or about 4-6 times deeper layer). The pollution is thus more dilute. I haven’t checked meteorology in the case of todays very poor air quality, but I suspect the effect of meteorology (even if mixing is deep and efficient) is overwhelmed by the emissions from all the fires southeast of Beijing.

What kind of fires? Or why are they burning? Great question! Are these forest fires like the lightning-triggered fires plaguing the Western USA right now? No! When you mask out the Terra MODIS fire data in a way that you only look at data from land that is mostly cropland (agriculture) in Eastern China, then you find something related to our findings in the Biogeosciences paper.

Fire season for land that is mostly agriculture (cropland in Eastern China) and land that is mostly non-agriculture (forests, grasslands).  This is based on the average over 10 years of data from MODIS.  More analysis like this in the link to my paper below.

Fire season for land that is mostly agriculture (cropland in Eastern China) and land that is mostly non-agriculture (forests, grasslands). This is based on the average over 10 years of data from MODIS. The region considered is roughly Mongolia and China. Other parts of the world look much different – more analysis like this in the link to my paper below.

The figure above shows that while the land with a low fraction of cropland (less than 20%) tends to burn in July-August, the land with a high fraction of cropland (greater than 80%) tends to burn in (you guessed it) June-July. As the caption states, these “average” seasonalities are based on over 10 years of Terra MODIS fire observations. When you average 10+ years of Junes for the low and high fraction of cropland, you get the data point in month six for blue and green curves above. In other words, the fires are right on schedule, Eastern China! Hopefully for the citizens of Beijing, the burning will be short-lived and meteorology will transport the smoke away and dilute it down with clean air in the process.

All that being said, a full scientific analysis of the air quality requires much more than this post offers. Sensitivity, ground-based analysis, meteorological analysis, and actual counting of the fires among other things would be required to prove with a much higher degree of confidence that my hypothesis does not fail, but usually scientists make hypotheses because they observe an event/phenomenon that is consistent or inconsistent within some sort of framework. In this case, what I saw in China air quality was inconsistent with what I understood about the meteorology there (for this time of year) and consistent with the work I did with colleagues regarding fire seasonality.

*The unit of concentration for PM2.5 is micrograms per cubic meter which is often written as ug/m3 even though the “u” should be the Greek letter “mu” which itself means “micro” which is one millionth and “m3” should be “m” with a superscript “3” to indicate “cubed”)

Twitter and science

I’ve been starting to use twitter – mainly to supplement my research interests. I have zero confidence in facebook as a useful platform for anything remotely scientific or supportive of science, but twitter somehow seems different. The first twitter account I followed was @BeijingAir early this calendar year as reports of ridiculously bad air quality emerged yet again. I was quickly impressed by this informal but rigorous reporting of hourly (!) air quality relevant metrics such as particulate matter (PM2.5) concentrations.twitter-science
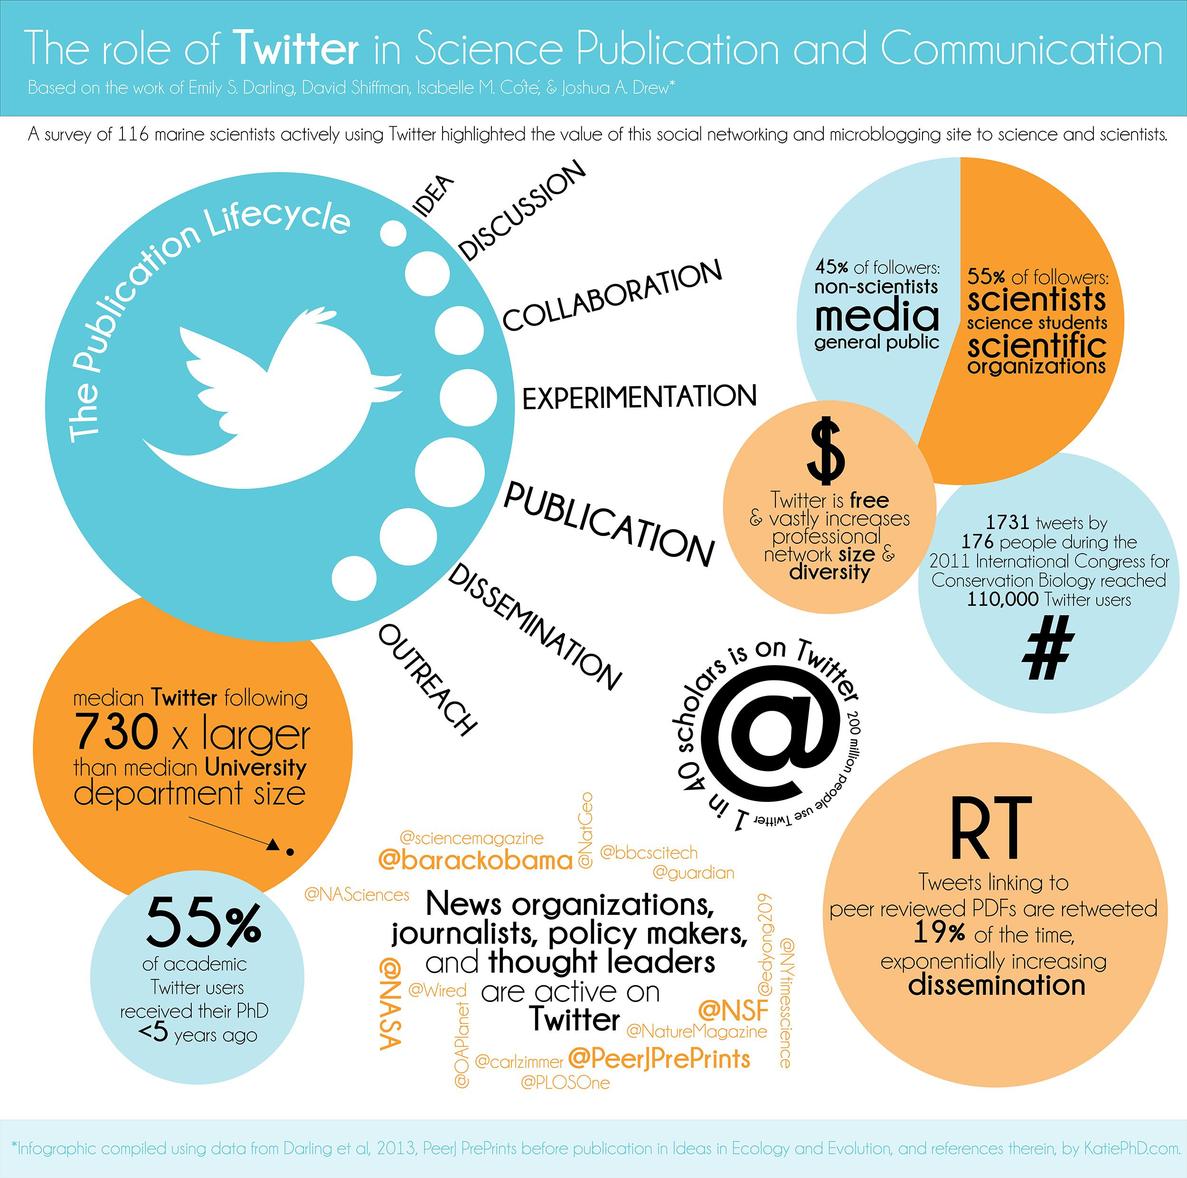
I even started to develop discussions around the US Embassy in Beijing twitter feed in my Atmospheric Chemistry class this past Spring semester, drawing comparisons between my published research from Africa (of essentially PM2.5) and the measurements reported @BeijingAir. I haven’t read my course reviews yet, so I don’t know whether my students liked these discussions or the problem sets that I made related to twitter. I liked it though because it was current and relevant in questions of applied atmospheric chemistry and thinking about our global society. The problems in our backyard are relevant, but I love to think that we as a global civilization can solve problems in a collective way. This philosophy is a natural fit with the concept of social media, and my opinion is that twitter is a better fit than other social media.

Then while I’m flipping through one of my various science digest emails over lunch one day, I see this article and realize that there is apparently a collective move of scientists to employing twitter as a serious way to connect. The figure above was posted in that article and you can click and see the higher resolution version. The analysis in that post resonates with how I’m thinking about twitter – namely it allows the science I do to have the potential to be much more relevant. Given that many undergraduates leave the university without even knowing what it is that an “assistant professor” does or what the difference is between an “assistant” and “associate” professor (or that the difference exists), I would say it is critical that the academy makes sure that the future minds walk away from their college degrees with some idea of what it is the professionals in front of the classroom or giving seminars are doing. Most of us assistant professors, for example, are not sitting around after classes stop for the summer drinking margeritas, but in all this surveying of people about climate change and global warming, I haven’t seen questions probing this awareness of what the academy is. Thin Ice actually touches on this topic in terms of what it is an Earth scientist does and why.

Which brings me back to twitter. The graphic above has the key points that I will watch for in twitter: 1. 45% of followers are non-scientists, media, general public, and 2. median twitter following is 730 times median department size. The other points are pretty darn good too! If you want to see what I’m tweeting, thinking, following, etc., visit my twitter feed @brianmagi. I’ll continue to sort through ideas and thoughts and announcements on my personal webpage and blog, but twitter will be great during the academic year when teaching takes a big chunk of my time.