Random Digit Dialing Sample
Participants:
A total of 370 adults aged 60 and older and 81 family caregivers in Charlotte and Mecklenburg County were interviewed by Customer Research International (CRI) utilizing a questionnaire designed by staff at The Gerontology Program. Respondents were screened in order to interview either the adult aged 60 or older in the household or a respondent providing care to this population. Additional screening was performed to ensure residence within Mecklenburg County. Caregivers were screened for those providing unpaid care to any relative or friend. Sampling was utilized to provide specific target quotas for Latino, African American, and Caucasian respondents. Both an English and Spanish language version of the questionnaire was made available. Spanish speaking households were called back by a bilingual interviewer in an attempt to complete the interview in Spanish. 21 total Spanish surveys were conducted.
Procedures:
Telephone numbers were purchased by CRI through Survey Sampling International (SSI) and Aristotle, both reputable sample providers. Interviews were conducted using computer-assisted telephone interviewing (CATI) software, which ensured all questions were asked correctly and all logic and skip patterns were implemented properly. The telephone sample was also managed by the CATI system, allowing dialing rules and disposition management to be streamlined. To ensure the highest response rate, each telephone number was called up to five times at various times of the day and week. Additionally, respondents were allowed to request a callback at a more convenient time and date. These appointments were called at the appointed time, and up to five additional times if the respondent was not available at the initially requested time.
Face-To-Face Convenience Sample
Participants:
Participants were recruited through a convenience sample by disseminating flyers to local community groups including: Mecklenburg County Libraries, YMCA of Greater Charlotte, El Camino Community Center, Shamrock Senior Center, Tyvola Senior Center, North Mecklenburg Senior Center, Charlotte Community Health Clinic and local places of worship.
Respondents were screened in order to interview either adults aged 60 or older or a respondent providing care to this population. A total of 388 adults aged 60 and older and 46 family caregivers in Charlotte and Mecklenburg County were interviewed. Both an English and Spanish language version of the questionnaire was made available. A total of 70 adults aged 60 and older and 8 family caregivers were interviewed in Spanish.
Procedures:
All screenings and interviews were conducted by trained Graduate Assistants from the University of North Carolina at Charlotte. Screenings were conducted over the phone and interviews were conducted at the participants home or at a public location near the participant’s home. Participation consisted of a 1 time face-to-face survey questionnaire that took no more than 1 hour of time.
Methods for Maps –
1. Data Preparation
The Meck60+ participants included their residential address, allowing spatial analysis of
the survey responses. The residential addresses were geocoded (converting addresses to
coordinates that can be displayed on a map) using ArcGIS Pro™. Subsequently, 738 addresses
were successfully geocoded using the Mecklenburg County street network as the reference
dataset from Mecklenburg County’s GIS Open Mapping online portal1. The locations of the
Counties’ parks, bus and light rail stations and routes also came from reference 1. The
socioeconomic and sociodemographic data was collected from the US Census’ 2016 ACS
Estimates dataset2. The geographic data (i.e. county boundary, zip code boundaries, and census
tract boundaries) were collected from the US Census’ Tiger/Line Shapefile dataset3 (2016
boundary data). The geocoded addresses were subsequently aggregated at both the zip code
and census tract levels.
2. Mapping Methodology
The majority of the maps were made using a choropleth mapping approach – a thematic
map that uses colors to represent the value of a statistical variable. Graduated colors were
used for the choropleth maps to identify spatial patterns of a particular variable (i.e. light
shades = small values; darker shades = high values). A quantile classification method was used
to separate the data values into distinct classes if the data was linearly distributed, where each
class contains an equal number of features. Otherwise, a Natural Breaks classification method
was used, where the class breaks are based on the natural groupings of the data – i.e.
maximizing the differences between classes. For multivariate mapping analysis, a bivariate
mapping approach was used. Bivariate maps is a variation of a choropleth map and can
displaying and showing the spatial relationship of two variables (e.g. income and education) for
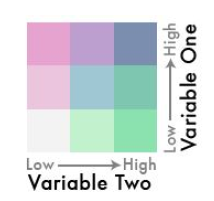
each areal unit (i.e. census tracts) in a study area. For this project, a 3×3 (9 class) bivariate
sequential color scheme was used (see Figure 1).
Figure 1 was take from Joshua Stevens’ “Bivariate Choropleth Maps: A How-to-Guide”4. In essence,
variable one’s values are from low to high on the vertical axis; and variable two’s values are from low to
high on the horizontal axis. For example, the white square on the bottom left of Figure 1 shows that a
location represented by that color indicates the lowest value class break for variable two and the lowest
value class break for variable one.
References
1. http://maps.co.mecklenburg.nc.us/openmapping/
2. https://factfinder.census.gov/faces/nav/jsf/pages/index.xhtml
3. https://www.census.gov/geographies/mapping-files/time-series/geo/tiger-line-file.html
4. http://www.joshuastevens.net/cartography/make-a-bivariate-choropleth-map/


