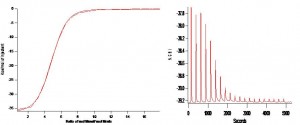
Brent Chesson has ITC data showing that the binding of Ca2+ to gelsolin decreases with increasing EAN concentration.
Figure 1. (A) 1.7uM Bovine Gelsolin in buffer with calcium chelated EGTA titrated against 100uM calcium chloride. Plot is derived from the integration of heats of binding, corrected for heats of ligand dilution. Thermodynamic analysis performed on NanoAnalyze (TA Instruments). Plot of best fit line from independent binding model. Gelsolin can bind up to eight calcium ions in transition to an active conformation. ΔH = -148.5 kJ/mol for complete saturation with calcium. Average binding affinity for Calcium Ka = 4.20 * 106 ,ΔS = -0.37 kJ/mol K , ΔH = -148.5 kJ/mol, ΔG = -38 kJ/mol. Ionic strength of solution = 0.045M. (B) Raw Isothermal Titration Calorimetry measurement of heat change over time for titration of 1.7uM Gelsolin in buffer with calcium chelated EGTA titrated against 100uM calcium chloride. Twenty automated injections of 2.5uL each at 25˚C. As Calcium is added strong exothermic peaks show favorable binding interactions of Calcium to Gelsolin. As gelsolin becomes saturated with calcium, exothermic peaks decrease to unspecified solvent interactions. These peaks represent heats of dilution and salvation and were used as a baseline and subtracted out for analysis.
Gelsolin in solution with 50mM EAN titrated with 0.100mM CaCl2
Figure 2. (A) 1.53uM Bovine Gelsolin in buffer with calcium chelated EGTA and 50mM EAN titrated against 100uM calcium chloride. Calcium binding and subsequent protein saturation requires two fold increase of moles of calcium to moles of gelsolin. Average binding affinity for Calcium Ka = 4.5 * 106 ,ΔS = -0.32 kJ/mol K , ΔH = -153.4 kJ/mol, ΔG = -37.9 kJ/mol. Ionic strength of solution = 0.099M. Increase in ionic strength of 120% compared to buffer without EAN. (B) Raw data from ITC.
Gelsolin in solution with 100mM EAN titrated with 0.100mM CaCl2
Figure 3. (A) 1.7uM Bovine Gelsolin in buffer with calcium chelated EGTA and 100mM EAN titrated against 100uM calcium chloride. Calcium binding and subsequent protein saturation requires eight fold increase of moles of calcium to moles of gelsolin. Average binding affinity for Calcium Ka = 1.00 * 107 ,ΔS = -0.32 kJ/mol K , ΔH = -133.9 kJ/mol, ΔG = -39.9 kJ/mol. Concentrations of 100mM EAN or less do not inhibit binding to protein for calcium concentrations up to 10uM. Ionic strength of solution = 0.146M, an increase of 224% compared to buffer without EAN. (B) Raw data from ITC.
Gelsolin in solution with 1.01 M EAN titrated with 0.100mM CaCl2
Figure 4. (A) 1.7uM Bovine Gelsolin in buffer with calcium chelated EGTA and 1.01M EAN titrated against 100uM calcium chloride. No binding of calcium to gelsolin observed. It is probable that extremely high concentrations of EAN may result in binding of calcium to protein. The higher ionic strength solution solvates the calcium ions and prevents binding to protein. Ionic strength = 1.01M, increase of 2100% compared to buffer without EAN. (B) Raw data from ITC. Graph is scaled to ranges in shown in calcium titrations of 0, .5, and 1% EAN for comparison.


