Congratulations to Carly Prevatte, the youngest of our group this summer and the first to present me with DATA!! Awesome work getting the reduction and analysis software figured out for the new Wyatt MLS instrument!
Data of the Week
Data of the Week 7-14-11
7-15-2010
Matt Jordan, rising senior from NCSSM, has created a pdb file of an EGTA-gelsolin monomer in a box filled with 10 wt% Ethylammonium Nitrate in H2O. Next step is to run an energy minimization and see what happens. Matt says, “hopefully I’ll be running simulations by the end of next week”.
07-02-2010
Brent Chesson has ITC data showing that the binding of Ca2+ to gelsolin decreases with increasing EAN concentration.
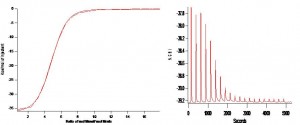
Figure 1. (A) 1.7uM Bovine Gelsolin in buffer with calcium chelated EGTA titrated against 100uM calcium chloride. Plot is derived from the integration of heats of binding, corrected for heats of ligand dilution. Thermodynamic analysis performed on NanoAnalyze (TA Instruments). Plot of best fit line from independent binding model. Gelsolin can bind up to eight calcium ions in transition to an active conformation. ΔH = -148.5 kJ/mol for complete saturation with calcium. Average binding affinity for Calcium Ka = 4.20 * 106 ,ΔS = -0.37 kJ/mol K , ΔH = -148.5 kJ/mol, ΔG = -38 kJ/mol. Ionic strength of solution = 0.045M. (B) Raw Isothermal Titration Calorimetry measurement of heat change over time for titration of 1.7uM Gelsolin in buffer with calcium chelated EGTA titrated against 100uM calcium chloride. Twenty automated injections of 2.5uL each at 25˚C. As Calcium is added strong exothermic peaks show favorable binding interactions of Calcium to Gelsolin. As gelsolin becomes saturated with calcium, exothermic peaks decrease to unspecified solvent interactions. These peaks represent heats of dilution and salvation and were used as a baseline and subtracted out for analysis.
Gelsolin in solution with 50mM EAN titrated with 0.100mM CaCl2
Figure 2. (A) 1.53uM Bovine Gelsolin in buffer with calcium chelated EGTA and 50mM EAN titrated against 100uM calcium chloride. Calcium binding and subsequent protein saturation requires two fold increase of moles of calcium to moles of gelsolin. Average binding affinity for Calcium Ka = 4.5 * 106 ,ΔS = -0.32 kJ/mol K , ΔH = -153.4 kJ/mol, ΔG = -37.9 kJ/mol. Ionic strength of solution = 0.099M. Increase in ionic strength of 120% compared to buffer without EAN. (B) Raw data from ITC.
Gelsolin in solution with 100mM EAN titrated with 0.100mM CaCl2
Figure 3. (A) 1.7uM Bovine Gelsolin in buffer with calcium chelated EGTA and 100mM EAN titrated against 100uM calcium chloride. Calcium binding and subsequent protein saturation requires eight fold increase of moles of calcium to moles of gelsolin. Average binding affinity for Calcium Ka = 1.00 * 107 ,ΔS = -0.32 kJ/mol K , ΔH = -133.9 kJ/mol, ΔG = -39.9 kJ/mol. Concentrations of 100mM EAN or less do not inhibit binding to protein for calcium concentrations up to 10uM. Ionic strength of solution = 0.146M, an increase of 224% compared to buffer without EAN. (B) Raw data from ITC.
Gelsolin in solution with 1.01 M EAN titrated with 0.100mM CaCl2
Figure 4. (A) 1.7uM Bovine Gelsolin in buffer with calcium chelated EGTA and 1.01M EAN titrated against 100uM calcium chloride. No binding of calcium to gelsolin observed. It is probable that extremely high concentrations of EAN may result in binding of calcium to protein. The higher ionic strength solution solvates the calcium ions and prevents binding to protein. Ionic strength = 1.01M, increase of 2100% compared to buffer without EAN. (B) Raw data from ITC. Graph is scaled to ranges in shown in calcium titrations of 0, .5, and 1% EAN for comparison.
06/25/2010
Jon Trullinger has measured a depolymerization rate for f-actin after addition of 5 wt% ethylammonium nitrate (EAN) using the Fluo-STAR Galaxy Plate reader (Ex @ 355 nm and Em @ 405nm)
The decrease in fluorescence intensity of pyrene-labeled actin measured as a function of time post-mixing with EAN shows that EAN has the ability to depolymerize actin. After a 300 sec equilibration time, 10 μL 50 wt% EAN was delivered, via an in-line syringe pump, to a well containing 100 μL 38 μg/ml pyrene-labeled F-actin. Depolymerization is observed as a decrease in fluorescence signal. Data were normalized to the maximum intensity measured prior to depolymerization for each sample. Measurements were done in triplicate. The average normalized intensity values with their standard deviation are shown. OriginPro v7.5 was used to determine the exponential fit parameters (a, b, k) as well as the initial rate of depolymerization.
y = a+be^(-kx)
a=0.02 b=1.51 k=0.0043
Rate = -0.015/sec
06-14-2010
Congratulations to the entire group who have worked hard and collected lots of good data this week. To Jon (MS Chemistry candidate UNCC/Walsh Fellow) who has optimized the BMG fluorimeter to collect pyrene-actin polymerization rate data and tested the detection limits. To George and Harrison, (NCBC and HHMI UG research fellows from UNCC and K’ College, respectively) who have shown that the 0.2 mm CD cells will work for collecting protein in EAN data and who have temperature-dependent CD data on the recombinant human GS protein. To Brent and Navid, (NSF Nanosure and UGs at UNCC) who have very interesting ITC data on bovine gelsolin titrations with varying concentrations of EAN. To Matt (NCSSM rising senior) who has learned in less than an hour how to download pdb files and view them in spdviewer and is ready to learn to use VMD and NAMD to run some very intriguing molecular dynamics simulations for us. And especially to Carly (Audrey Kell rising junior) who has made 85g of gorgeous looking muscle acetone powder from 600g of muscle tissue in record time!
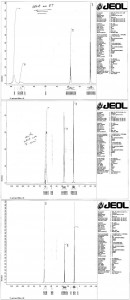
As most of the data presented this week is in the preliminary stages and still require analysis however, I have chosen this week’s DATA of the WEEK to be the NMR data that was used to devise a strategy for the purification of an unknown 500-ml sample of EAN. Led by Brent and Jon, my lab collectively decided that it makes no sense to let a 500-ml sample of EAN of unknown origin or purity sit around the lab unlabeled and uncharacterized. On their own, they checked its purity by H-NMR, top panel, determined (from the NMR and by examining a cryptic notebook describing its synthesis) that it contained an xs of nitric acid and other contaminants. They then re-reacted it with ethylamine (middle panel) filtered and dehydrated it to generate a clean, well-characterized sample (bottom panel) for use in our planned experiments this summer! WAY to be pro-active LAB!! and thank you.
06-07-2010
Jon Trullinger has finished analyzing the SAXS data on lysozyme pH3.8 in 0 – 40 wt% Choline Dihydrogen Phosphate (CDHP).
Major Conclusions:
1) The presence of CDHP in the buffer eliminates interparticle interference effects on the data. These concentration-dependent effects are indicated by a suppressed intensity at the low Q region and are typically observed for lysozyme at this pH due to Coulombic repulsion between the highly charged lysozyme molecules in solution (note the rollover in the data for the 0% sample (grey) and its absence in the 5 – 40% CDHP data (cyan, 5 wt% CDHP; blue, 10%; purple, 20%; and magenta, 30%).
2) The presence of CDHP in the solution does not affect the overall shape/fold of the protein. Although the intensities of the data are systematically decreased as a result of increasing scattering density of the CDHP-containing solvent (decreased contrast between protein and solvent), the shapes of these curves are similar and predict a globular protein shape that fits well with the crystal structure (see inset of figure). The data are fit to that calculated from pdb no. XXXX and the reduced chi values of these fits are reported.
6-01-2010 recombinant Human Gs
George Alyateem followed a modified expression and purification protocol for recombinant Human Gelsolin resulting in ~10 mgs of >95% purity. New lessons learned- 1) Don’t let the culture grow too long before innoculation: innoculate the culture when it has reached an OD600 of 0.5 with 1 mM IPTG then collect the cells at 3 hours post-induction. 2) Homogenize the cell lysate in order to shear the viscous nucleic acid contamination and avoid clogging up the spin column (benzonase was not required!). 3)Wash the Ni-resin bound protein with 25 mM Imidazole extensively (maybe even more than we did). Gelsolin will begin to elute in 50 mM imidazole but so does alot of other contaminating proteins. Best elution conditions for Gs is 100 – 150 mM imidazole.
Below is an SDS-PAGE gel of his HIS-tag affinity purification steps.
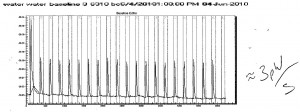
Runner up for Data of the week this week, is Brent Chesson’s ITC data. Brent improved his ITC technique consistently obtaining a 3 pW/s baseline (water-water titration).
He then tested his technique with an Acetic Acid titration experiment (self-designed). His analysis (still in process of perfection) gave a pKa of 4.618 which compares well with the literature value of 4.64! Lessons learned include: 1) de-gas all your solutions! 2) Load identical volumes in the sample and reference cells (300 uL min and 500 uL max) and 3) clean the cells well to get your baseline to 3 pW/s. [Both before and after your experiment]


