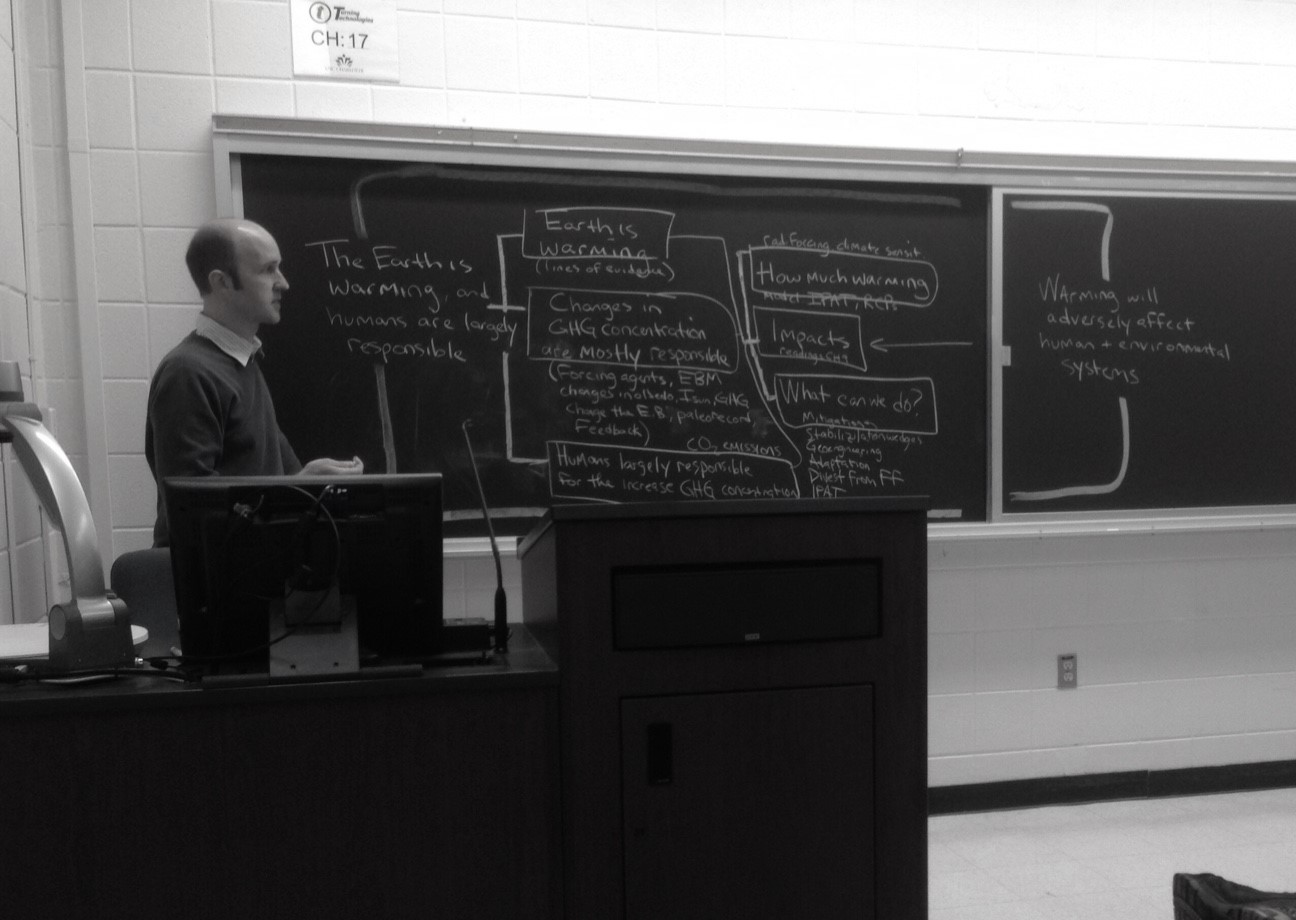
teaching

Climate change and debate

An interesting article about the amazing climate change humans are causing was published by the UNC Charlotte campus newspaper back in Spring 2014, but it’s worth re-visiting as our atmosphere once again reached 400 ppm CO2 concentration. The piece was published as a point-counterpoint discussion, but as many scientists (include myself) point out, science is not about considering all sides – it’s about considering what the evidence suggests. I wrote a letter in response to the viewpoint that climate change is no big deal. If the evidence from multiple experiments/studies suggests a single point is true, then that’s where the scientific community will tend towards when explaining that science. As the evidence builds and builds with no one finding counter-evidence, the conclusions become more and more robust*. If the evidence suggests mixed or nuanced results, then scientists will talk about that science as inconclusive and continue to try to design better experiments or get more data or both. Most importantly, perhaps, if counter-evidence arises repeatedly, scientific conclusions will change in response. Science is a beautiful, self-correcting process.

In Spring 2014, I sat down with a Niner Times reporter and Twitter friend Ed Averette and talked with him about how I see climate science, and how I talk about the science of climate change in my classroom (most prominently in ESCI 3101, Global Environmental Change). I had a lot to say, mostly because I had just returned from a wonderful conference called the Carolinas Climate Resilience Conference in April 2014, where I talked about Climate Change in the University Classroom (presentation here!), and I met some amazing outreach-oriented people (Kirstin Dow, Greg Carbone, Jim Gandy), and learned a climate change song that could be played on a dulcimer sung by this NPS Ranger. The article Averette wrote is available online and includes a figure I made for my class lectures.

The amazing correlation between Earth's temperature and CO2 concentration in the atmosphere, as derived from multiple ice core datasets shown in the graph itself.

The amazing correlation between Earth’s temperature and CO2 concentration in the atmosphere, as derived from multiple ice core datasets shown in the graph itself.

Another Niner Times reporter, Louis Aiello, provided the (journalistic) opposing viewpoint that there is no need to panic when it comes to the present-day climate change and his article is available online as well. Both articles are worth reading since they echo the innate concern we have for our planet, but that at the same time, the problem can feel overwhelmingly large**. Aiello never spoke with me, or as far as I could tell, any expert in the field of climate science, so of course I agree more with the approach Averette used, and found myself strongly disagreeing with Aiello’s article. I wrote a letter to the Niner Times in response to Aiello’s article, and I wrote a shorter version of that letter as well for the print newspaper. I did this because I often think about this artificial public debate that exists in the face of a broad scientific consensus about many points regarding the present-day climate change, and I also think that scientists need to speak up when they know about a topic.
Screenshot of the print version of my letter that had a limited number of words I could include.  Hence the online letter is longer.

Screenshot of the print version of my letter that had a limited number of words I could include. Hence the online letter is longer.


*Gravity is a good example. Go measure the acceleration if you want, but you’re likely to find the same thing any scientist will find. Acceleration due to gravity is 9.8 meters per second every second that an object falls. Thus, this is essentially a fact in our world, but it arose from evidence, not our gut feeling.

**This philosophy of how a single person drawing from a common resource scales up to major problems is known as the Tragedy of the Commons, which has been spoken about eloquently by many many people, including wikipedia.

Voting for action on global environmental change

global-201101-201112As real as global warming (figure above from NOAA NCDC) is, and as much as we expect that the science has done enough, one US lawmaker recently said

I am for global action on climate change. I am a proud supporter and very anxious for the U.S. to participate globally. But I think if you look at the current makeup of the U.S. Senate, it’s very difficult.

This is a quote from Senator Ben Cardin (D-Md.) that I drew from a recent article that I’ll get to below. As I close off discussions with 28 undergraduate students of Earth Sciences, Geology, Meteorology, and Economics this semester in my Global Environmental Change course, the questions that permeate their responses to readings* we went over in class are

1. WHAT CAN WE DO?
2. WHY AREN’T WE DOING ANYTHING?

I bring a lot of current discussion into the classroom – more than the previous iteration of my course and I await my course reviews and student comments to better understand which materials resonated and which did not. In the meantime, my answer to the driving questions for the future of our state and country is simple: VOTE. Vote for the legislators that work on issues that you think benefit the global community.

The simplicity in my answer is partly because I don’t have a better answer, but partly because this is where the science stands. Namely, science has arrived at robust conclusions based on decades of intense research by communities of experts, most recently evidenced by the full report of the IPCC. Earth scientists keep working on issues because we are interested in what makes the physical world tick, and just like any community of professionals, the majority of us work on science that is relevant. The most relevant Earth science is climate science. I think it is safe to say that most Earth scientists want to see some actual climate action rather than the empty words that most that most of the action statements by politicians have amounted to so far. A widely-cited scientific paper about a way to visualize and break down carbon mitigation strategies into manageable parts said that the choice is simple: Act or delay.

If we want action, we cannot rely solely on science and engineering – we need policy makers. Policy makers are elected by people. So if my students want to help, vote. If citizens in general want to help, then vote. An interesting report by Lisa Friedman at Energy and Environment News included quotes from US lawmakers about the upcoming 2015 Paris climate meeting that many were hoping would be much farther along after this year’s Poland climate meeting. I’ll include several below:

It will be difficult to get a treaty passed in 2015 in the U.S. Senate as it is presently constituted

———————————–> Sen. Ed Markey (D-Mass.)

Keep our eyes on the prize of creating an ambitious, effective and durable agreement. Insisting that only one way can work, such as an agreement that is internationally binding in all respects, could put that prize out of reach.

———————————–> U.S. Special Envoy for Climate Change Todd Stern

[A binding agreement is] not going to go anywhere. It’s dead on arrival… [EPA limits on CO2 emissions from future power plants are] hurting our economy on a daily basis.

———————————–> Sen. John Barrasso (R-Wyo.)

There is a lot of difference of opinion among very educated people on the science [of global warming]. [On whether a binding agreement would pass the Senate: ] I kind of doubt it. There is still a legitimate question of science, and you can’t brush that away.

———————————–> Sen. Orrin Hatch (R-Utah)

I think this [a global climate treaty] is an issue that can flip very quickly. [An EPA regulation, for example, would] put a lot of costs on polluters and cause them to rethink the wisdom of an economywide carbon fee. If we can organize the armies on our side, it’s a rout. We just haven’t bothered to organize them. [The fact that climate is back in the political discussion and may be in 2014 means] that adds up to 2015 being a pretty good year.

———————————–> Sen. Sheldon Whitehouse (D-R.I.)

This problem is global, not just related to any one country or only one region. We need an international effort, and I think there’s growing support for that in the United States.

———————————–> Rep. Henry Waxman (D-Calif.)

We need to set a good example to the rest of the world. That way, when we call on China and India and other big emitters, we can say not only ‘Do as I say,’ but ‘Do as I do.’

———————————–> Sen. Tom Carper (D-Del.)

Increasingly, the U.S. is being viewed as a leader. Especially if the administration takes action on coal-fired power plants, I think it will be very hard, then, for China and India to say the U.S. is not acting.

———————————–> Sen. Ed Markey (D-Mass.)

[Action might require] some kind of catastrophe… I think [global warming and subsequent impacts are] real, and I think that we should continue to explore our options to reduce the effects of it. [He has not liked] anything I’ve seen lately [about how the UN climate process has influenced US lawmakers.] [Still, he conceded,] I don’t think talking hurts. It probably helps.

———————————–> Sen. John McCain (R-Ariz.)

Are pathways opening up? Has Obama been able to set up his position strongly enough to promote policies that are in line with the science? Well, it comes back to the simple solution: Vote for what you believe. I would argue that your political party – socially or economically – is not the relevant part of a vote that supports climate change policy.

As Professor Andrew Dessler argues in his book, and as many other climate and climate policy scientists argue, the decision to move away from energy sources with high carbon emissions is completely reversible – if the climate science summarized in the IPCC reports is entirely wrong or even partly wrong about carbon cycle science,

Figure 2 from Chapter 6 (Carbon and Other Biogeochemical Cycles) FAQ 6.1 of IPCC AR5 Working Group 1.  Shows that some fraction of a 5000 GtC pulse of carbon emissions - on scale with a pulse from burning all fossil fuel reserves - would affect the atmosphere for 1,000s to 100,000s of years.  Roughly 40% of the pulse would remain in the atmosphere even after 2000 years.

Figure 2 from Chapter 6 (Carbon and Other Biogeochemical Cycles) FAQ 6.1 of IPCC AR5 Working Group 1. Shows that some fraction of a 5000 GtC pulse of carbon emissions – on scale with a pulse from burning all fossil fuel reserves – would affect the atmosphere for 1,000s to 100,000s of years. Roughly 40% of the pulse would remain in the atmosphere even after 2000 years.

we can always go back to burning the least expensive energy sources without regard to the environment. But if climate science is even close to right, then we are facing irreversible changes (see the figure above) to the carbon cycle that will affect the Earth for centuries, millenia, and even further.

As I told my students, the questions that we face are civilization scale (echoing Rep. Waxman’s quote above). Human civilization emerged as a presence on Earth somewhere between 20,000 and 200,000 years ago. I’m no archaeologist, so that number isn’t particularly important. The point is that dinosaurs managed to survive for 165 million years on Earth and evolve into the Cretaceous Period species that we know and love (tyrannosaurus rex, triceratops, etc.). It sure would be nice to think that our advanced technology means we can learn to live in harmony with the planet longer than the dinosaurs! Considering that the dinosaurs were finally offed by a meteorite, I’d say we have a lot to prove still.

*readings from Elizabeth Kolbert, Andrew Dessler, IPCC AR4 and AR5, news posts from New York Times and Washington Post, and multimedia presentations such as Thin Ice, Earth The Operators Manual, and data visualizations and tools focusing on climate-relevant data like carbon emissions, temperature records, and climate model projections

Undergraduate students scouring internet for global warming articles

Ramping up for teaching with NOAA NCDC

Summer is a time of dedicated research for me. Finished one project, waiting for peer reviews on that manuscript, tinkering with twitter, planning out research conference travel in the next school year, and working on a grant proposal to NSF. The season of the classroom is nearly here though, so I’m slowly re-allocating my hours to teaching. A great early-career workshop for university and college faculty that I attended the last week of July helped me get into gear with teaching again. I need a workshop like that every summer!

Another way I start to think about teaching is to begin to browse through the data that I want to bring into the classroom. One site I haven’t visited in months, but that I prolifically visit throughout past school years, is the NOAA NCDC time series plotter. I had the pleasure of visiting the numbers again tonight and remain very impressed by NCDC outreach and transparency efforts. The new addition to the time-series plotter (which you can use to produce climate-relevant analysis at different spatial and temporal scales) is a slightly more friendly user-interface, and a few features that I think most stats people will really appreciate. Yes, it’s not a super fancy analysis package, but the statistical analysis you can do just via the webpage now includes two new options. One is the option to display the anomaly against a different base period rather than always using the 20th Century average. In other words, you can choose a base period of 1951-1980 like NASA GISS tends to use or you can play around and see what the effect of a different base period is. The other new option is a display of a trend line for any period. The first thing you can do with this is see how temperature (for example) trends in the early part of the century compare to the trends in the latter part of the century. Or you can mimic the cherry picking that climate data is sometimes a victim to and choose very specific start and end points to produce a trend that amplifies an argument you are making (“look, it’s getting colder!” or “look, it heating up super fast”). one exception to all this great online analysis is that it only applies at the “super” level for data in the contiguous USA. someday, i’ll ask NCDC scientists why this can’t be done for Alaska and Hawaii, and why the global analysis tools are more limited. either way, an exciting development in my virtual friendship with NOAA NCDC.

Twitter and science

I’ve been starting to use twitter – mainly to supplement my research interests. I have zero confidence in facebook as a useful platform for anything remotely scientific or supportive of science, but twitter somehow seems different. The first twitter account I followed was @BeijingAir early this calendar year as reports of ridiculously bad air quality emerged yet again. I was quickly impressed by this informal but rigorous reporting of hourly (!) air quality relevant metrics such as particulate matter (PM2.5) concentrations.twitter-scienceI even started to develop discussions around the US Embassy in Beijing twitter feed in my Atmospheric Chemistry class this past Spring semester, drawing comparisons between my published research from Africa (of essentially PM2.5) and the measurements reported @BeijingAir. I haven’t read my course reviews yet, so I don’t know whether my students liked these discussions or the problem sets that I made related to twitter. I liked it though because it was current and relevant in questions of applied atmospheric chemistry and thinking about our global society. The problems in our backyard are relevant, but I love to think that we as a global civilization can solve problems in a collective way. This philosophy is a natural fit with the concept of social media, and my opinion is that twitter is a better fit than other social media.

Then while I’m flipping through one of my various science digest emails over lunch one day, I see this article and realize that there is apparently a collective move of scientists to employing twitter as a serious way to connect. The figure above was posted in that article and you can click and see the higher resolution version. The analysis in that post resonates with how I’m thinking about twitter – namely it allows the science I do to have the potential to be much more relevant. Given that many undergraduates leave the university without even knowing what it is that an “assistant professor” does or what the difference is between an “assistant” and “associate” professor (or that the difference exists), I would say it is critical that the academy makes sure that the future minds walk away from their college degrees with some idea of what it is the professionals in front of the classroom or giving seminars are doing. Most of us assistant professors, for example, are not sitting around after classes stop for the summer drinking margeritas, but in all this surveying of people about climate change and global warming, I haven’t seen questions probing this awareness of what the academy is. Thin Ice actually touches on this topic in terms of what it is an Earth scientist does and why.

Which brings me back to twitter. The graphic above has the key points that I will watch for in twitter: 1. 45% of followers are non-scientists, media, general public, and 2. median twitter following is 730 times median department size. The other points are pretty darn good too! If you want to see what I’m tweeting, thinking, following, etc., visit my twitter feed @brianmagi. I’ll continue to sort through ideas and thoughts and announcements on my personal webpage and blog, but twitter will be great during the academic year when teaching takes a big chunk of my time.

Thin Ice film screening

I watched the soon-to-be-officially-released new film about climate science and climate scientists called Thin Ice today. I read about Thin Ice on the RealClimate blog, where the blog author (an Atmospheric Scientist who is interviewed in the film itself) posted that screenings of Thin Ice were being planned for Earth Day 2013 (22 April). Great idea! The film makers say

Join us on Earth Day, April 22nd, 2013 for the global launch of Thin Ice: The inside story of climate science. The film will be available for free online here or can be seen in person at various screenings around the world from April 22nd-23rd.

Since I teach a course about global warming in the Spring and Fall semester here at UNC Charlotte, I immediately thought that this would be a valuable multimedia way to incorporate more than just me talking about the world of climate science with my 12 students. Turns out the documentary-style film is really accessible. A geologist named Simon Lamb starts the movie by talking about his motivation – kind of like you would if you were writing a scientific paper intended for publication. Namely, Lamb poses the hypothesis that climate scientists are “peddling a lie” – a hypothesis that any person in the world could arrive at fairly easily given the way that climate science is discussed outside the scientific world at times. Lamb tests his hypothesis by talking with climate scientists and learning about what they do and, more importantly in my opinion, WHY. The answer to why isn’t stated explicitly, but I think it is the common thread linking the scientists working on understanding the amazing climate system. Certainly, the movie and the conclusions resonate with me. The Earth is an amazing place, and humans working for the greater good truly raise the collective level of optimism about the future.

If you want to sit in on the UNC Charlotte screening, I will show the movie from 11:00-12:15 on Monday April 22 (Earth Day). No admission. Send me an email if you plan to be there. I signed up for the screening via the Thin Ice website, so you can see the official screening annoucement here if you search Charlotte.

Resources to understand global warming

There is a treasure trove of information and misinformation about global warming on the mighty internet. I try to sift through these as I prepare for effective ways to empower students or at least generate discussion. Here are a couple of new-ish resources that visualize the NASA GIStemp gridded temperature anomaly data set, which are described in great detail on that website but also in the peer-reviewed science literature. The New Scientist (UK popular science magazine) created this webapp to allow anyone to point and click on a location to see how the temperature has changed since about 1890. Here’s a snippet of the Southeast USA anomaly averaged from 1893-1912 warming-southeast-1890and then from 1993-2012 warming-southeast-2000The global warming trend is presented on the right side, while the temperature trend for the specific location is right above it. What’s really nice is the pop-up window that the app opens when you hover over that location-specific temperature trend. You can see the data that’s plotted! Admittedly, it’s pretty easy to get from NASA GISS as indicated via the links on the webapp itself, but still, it’s a great effort by the New Scientist to make sure any person who wants to can reproduce the analysis. And, most importantly, the app itself is a really accessible way to “see” global warming. Other temperature data sets (HadCRU, NOAA NCDC, and a couple of others) have trends that are very similar to NASA GISS – if I find a link showing this comparison, I will post it.

Changes to Global Environmental Change webpage

Categories: Group News

just a few notes about the changes to my teaching webpage for my Global Environmental Change (ESCI 3000 this semester – Fall 2012, expected to be ESCI 3101 by Fall 2013) webpage. i updated just about everything there so the interface would be more useful for students, but there are many links to climate-related internet sources for discussion, books, visualizations, and of course DATA related to climate science. i will point out that the NCDC websites and the CMIP5 websites are especially useful. CMIP5 is family of model experiments that will support IPCC AR5 which is being written and revised this year and expected to be published sometime in 2013. CMIP3, I think, were the model experiments that supported IPCC AR4 publications in 2007.