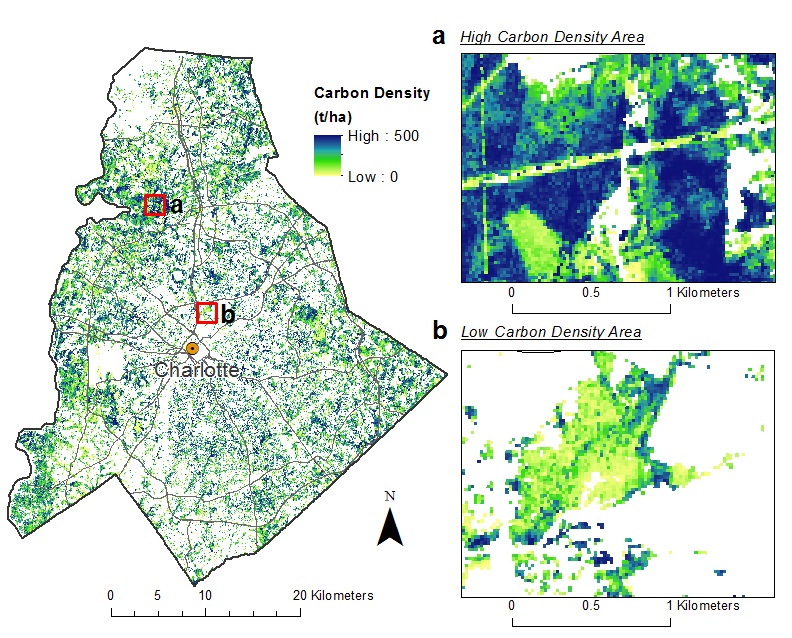
The Laboratory for Remote Sensing and Environmental Change (LRSEC)
An Interdisciplinary Research Group Using Remote Sensing and Geospatial Science to Understand Landscape Change
  • Home
  • Publications
  • Research Products
  • Team
    • Dr. Gang Chen
    • Chenyu Xing
    • Ravi Thapaliya
    • Rachel Caron
    • Justin Erlick
    • Austin Barbee
  • Prospective Students
  • Teaching
  • News

Latest News in LRSEC

  • Welcome Austin Barbee to join LRSEC October 3, 2024
  • Welcome Justin Erlick to join the lab September 16, 2024
  • Welcome Rachel to join the lab March 21, 2024

Contact Lab Director

Dr. Gang Chen
Address: McEniry 446, 9201 University City Blvd, Charlotte, NC 28223, USA (35°18'26"N 80°43'48"W)
Email: Gang.Chen 'at' charlotte.edu

Links

  • Department of Earth, Environmental and Geographical Sciences
  • College of Humanities & Earth and Social Sciences
  • University of North Carolina at Charlotte
Assistant Professor, Department of Geography and Earth Sciences
AUTHOR

Gang Chen

New findings recognized by ISPRS Journal of Photogrammetry and Remote Sensing

January 09, 2015 by Gang Chen
Categories: Updates

A team led by Dr. Chen and researchers from NC State, UC Davis and Lewis & Clark College recently published their new findings in ISPRS Journal of Photogrammetry and Remote Sensing.

Title: Object-based assessment of burn severity in diseased forests using high-spatial and high-spectral resolution MASTER airborne imagery

Abstract: Forest ecosystems are subject to a variety of disturbances with increasing intensities and frequencies, which may permanently change the trajectories of forest recovery and disrupt the ecosystem services provided by trees. Fire and invasive species, especially exotic disease-causing pathogens and insects, are examples of disturbances that together could pose major threats to forest health. This study examines the impacts of fire and exotic disease (sudden oak death) on forests, with an emphasis on the assessment of post-fire burn severity in a forest, where trees have experienced three stages of disease progression pre-fire: early-stage (trees retaining dried foliage and fine twigs), middle-stage (trees losing fine crown fuels), and late-stage (trees falling down). The research was conducted by applying geographic object-based image analysis (GEOBIA) to MASTER airborne images that were acquired immediately following the fire for rapid assessment and contained both high-spatial (4 m) and high-spectral (50 bands) resolutions. Although GEOBIA has gradually become a standard tool for analyzing high-spatial resolution imagery, high-spectral resolution data (dozens to hundreds of bands) can dramatically reduce computation efficiency in the process of segmentation and object-based variable extraction, leading to complicated variable selection for succeeding modeling. Hence, we also assessed two widely used band reduction algorithms, PCA (principal component analysis) and MNF (minimum noise fraction), for the delineation of image objects and the subsequent performance of burn severity models using either PCA or MNF derived variables. To increase computation efficiency, only the top 5 PCA and MNF and top 10 PCA and MNF components were evaluated, which accounted for 10% and 20% of the total number of the original 50 spectral bands, respectively. Results show that if no band reduction was applied the models developed for the three stages of disease progression had relatively similar performance, where both spectral responses and texture contributed to burn assessments. However, the application of PCA and MNF introduced much greater variation among models across the three stages. For the early-stage disease progression, neither band reduction algorithms improved or retained the accuracy of burn severity modeling (except for the use of 10 MNF components). Compared to the no-band-reduction scenario, band reduction led to a greater level of overestimation of low-degree burns and underestimation of medium-degree burns, suggesting that the spectral variation removed by PCA and MNF was vital for distinguishing between the spectral reflectance from disease-induced dried crowns (still retaining high structural complexity) and fire ash. For the middle-stage, both algorithms improved the model R2 values by 2% to 37%, while the late-stage models had comparable or better performance to those using the original 50 spectral bands. This could be explained by the loss of tree crowns enabling better signal penetration, thus leading to reduced spectral variation from canopies. Hence, spectral bands containing a high degree of random noise were correctly removed by the band reduction algorithms. Compared to the middle-stage, the late-stage forest stands were covered by large piles of fallen trees and branches, resulting in higher variability  of MASTER imagery. The ability of band reduction to improve the model performance for these late-stage forest stands was reduced, because the valuable spectral variation representing the actual late-stage forest status was partially removed by both algorithms as noise. Our results indicate that PCA and MNF are promising for balancing computation efficiency and the performance of burn severity models in forest stands subject to the middle and late stages of sudden oak death disease progression. Compared to PCA, MNF dramatically reduced image spectral variation, generating larger image objects with less complexity of object shapes. Whereas, PCA-based models delivered superior performance in most evaluated cases suggesting that some key spectral variability contributing to the accuracy of burn severity models in diseased forests may have been removed together with true spectral noise through MNF transformations.

Sample objects (with white polygon boundaries) derived from five band-reduction scenarios: (a) no band reduction (i.e., 50 bands), (b) 5 PCA components, (c) 10 PCA components, (d) 5 MNF components, and (e) 10 MNF components, overlaid on images with RGB composites of (a) bands 5, 3, and 1, and (b-e) components 1, 2, and 3. The backdrop of (a) is a true color composite using MASTER bands 5, 3, and 1, where light tones represent ash, brown colors indicate moderate burns in forest stands, and a small portion of green trees reveal low level of fire damage. The backdrops of (b) and (c) are the color composites using the first three PCA components, while the backdrops of (d) and (e) are the color composites using the first three MNF components.

Sample objects (with white polygon boundaries) derived from five band-reduction scenarios: (a) no band reduction (i.e., 50 bands), (b) 5 PCA components, (c) 10 PCA components, (d) 5 MNF components, and (e) 10 MNF components, overlaid on images with RGB composites of (a) bands 5, 3, and 1, and (b-e) components 1, 2, and 3. The backdrop of (a) is a true color composite using MASTER bands 5, 3, and 1, where light tones represent ash, brown colors indicate moderate burns in forest stands, and a small portion of green trees reveal low level of fire damage. The backdrops of (b) and (c) are the color composites using the first three PCA components, while the backdrops of (d) and (e) are the color composites using the first three MNF components.

Collaborative research paper accepted by ISPRS Journal of Photogrammetry and Remote Sensing

January 02, 2015 by Gang Chen
Categories: Updates

A manuscript completed by Dr. Chen and his collaborators at North Carolina State University was recently accepted by ISPRS Journal of Photogrammetry and Remote Sensing, a high-profile remote sensing journal.

Title: Effects of LiDAR point density and landscape context on estimates of urban forest biomass

Abstract: Light Detection and Ranging (LiDAR) data is being increasingly used as an effective alternative to conventional optical remote sensing to accurately estimate aboveground forest biomass ranging from individual tree to stand levels. Recent advancements in LiDAR technology have resulted in higher point densities and improved data accuracies accompanied by challenges for procuring and processing voluminous LiDAR data for large-area assessments. Reducing point density lowers data acquisition costs and overcomes computational challenges for However, how does lower point density impact the accuracy of biomass estimation in forests containing a great level of anthropogenic disturbance? We evaluate the effects of LiDAR point density on the biomass estimation of remnant forests in the rapidly urbanizing region of Charlotte, North Carolina, USA. We used multiple linear regression to establish a statistical relationship between field-measured biomass and predictor variables (PVs) derived from LiDAR point cloud data with varying densities. We compared the estimation accuracies between a general Urban Forest type and three Forest Type models (evergreen, deciduous, and mixed) and quantified the degree to which landscape context influenced biomass estimation. The explained biomass variance of the Urban Forest model, using adjusted R2, was consistent across the reduced point densities, with the highest difference of 11.5% between the 100% and 1% point densities. The combined estimates of Forest Type biomass models outperformed the Urban Forest models at the representative point densities (100% and 40%). The Urban Forest biomass model with development density of 125 m radius produced the highest adjusted R2 (0.83 and 0.82 at 100% and 40% LiDAR point densities, respectively) and the lowest RMSE values, highlighting a distance impact of development on biomass estimation. Our evaluation suggests that reducing LiDAR point density is a viable solution to regional-scale forest assessment without compromising the accuracy of biomass estimates, and these estimates can be further improved using development density.

Predicted biomass categorized by LiDAR point density reduction with red horizontal line indicating the median of observed biomass.

Predicted biomass categorized by LiDAR point density reduction with red horizontal line indicating the median of observed biomass.

Undergraduate research to appear in high-profile international journal - Landscape & Urban Planning!

December 12, 2014 by Gang Chen
Categories: Updates

Christopher Godwin, a former undergraduate research assistant has his work accepted by a high-profile international journal Landscape & Urban Planning. Congrats, Chris!

Research title: The impact of urban residential development patterns on forest carbon density: An integration of LiDAR, aerial photography and field mensuration

Abstract: Urban development continues to reshape forest landscapes and influence the carbon storage capacity of trees. To date, the impact of urban patterns on forest carbon density remains to be systematically evaluated. A major challenge is the lack of accurate and spatially explicit estimates of forest carbon storage over the entire urbanized area. In this study, we first developed an integrated approach that synergizes remote sensing LiDAR (light detection and ranging) and aerial photography to efficiently model landscape-level forest carbon storage in an urban environment at a fine resolution of 20 meters. Using a case study in the Charlotte Metropolitan Region, USA, we were able to determine the total amount of carbon stored in the local forests to be 3.8 million tonnes ($298 million value), with an average carbon density of 53.6 tonnes per hectare. We further applied statistical analysis to investigate the relationship between urban developed patterns (i.e., landscape metrics) and forest carbon density in four types of residential neighborhoods (categorized by percent built-up ranging from low, medium-low, medium-high to high density). Results indicate a decrease of forest carbon density with an increase of carbon variance in neighborhoods where the intensity of development became higher. Residential neighborhoods with a higher built-up density were more likely to be affected by a larger number of landscape metrics. This indicates that a proper design of the neighborhood level urban spatial patterns (especially in high density neighborhoods) is essential to maximizing forest carbon storage at the landscape level.

Charlotte Carbon Map

Forest Carbon Map of Charlotte

Undergraduate work published in international journal - Remote Sensing Letters

November 14, 2014 by Gang Chen
Categories: Updates

Carolynne Hultquist, our former undergraduate student, published her work in an international remote sensing journal – Remote Sensing Letters. Congrats, Carolynne! Carolynne is currently a PhD student studying Geography at Penn State.

Research title: A comparison of Gaussian process regression, random forests and support vector regression for burn severity assessment in diseased forests

Abstract: Remote sensing has been widely adopted to map post-fire burn severity over large forested areas. Statistical regression based on linear or simple non-linear assumptions is typically used to link post-fire forest reflectance with the degree of burn severity. However, this linkage becomes complicated if forests experienced severe mortality caused by pre-fire disease or insect outbreaks, which is likely to occur more frequently as a result of rapid climate change. In an effort to improve the understanding of the relationship between forest reflectance and fire-disease disturbances, this study explored the efficacy of three machine learning techniques, that is, Gaussian process regression (GPR), random forests (RF) and support vector regression (SVR), within a geographic object-based image analysis (GEOBIA) framework to assess burn severity in a forest subject to pre-fire disease epidemics. MASTER [MODIS (Moderate Resolution Imaging Spectroradiometer)/ASTER (Advanced Spaceborne Thermal Emission and Reflection Radiometer)] airborne sensor was applied to collect relatively high spatial (4 m) and high spectral (50 bands) resolution reflectance data. Results show that RF, SVR and GPR models outperformed conventional multiple regression by 48%, 29% and 27%, respectively. Compared to SVR and GPR, RF not only achieved better performance in burn severity assessment, but also demonstrated lower sensitivity to the application of different combinations of remote sensing variables. In addition to Normalized Burn Ratio (NBR), this study further revealed the importance of image-texture (representing spectral variability within and between neighbourhood forest patches) in burn severity mapping over diseased forests.

Collaborative research to appear in International Journal of Applied Earth Observation and Geoinformation

August 14, 2014 by Gang Chen
Categories: Updates

A recent study conducted by Dr. Chen and his collaborators at the University of British Columbia was published in the International Journal of Applied Earth Observation and Geoinformation.

Title: Remote sensing and object-based techniques for mapping fine-scale industrial disturbances.

Abstract: Remote sensing provides an important data source for the detection and monitoring of disturbances; however, using this data to recognize fine-spatial resolution industrial disturbances dispersed across extensive areas presents unique challenges (e.g., accurate delineation and identification) and deserves further investigation. In this study, we present and assess a geographic object-based image analysis (GEOBIA) approach with high-spatial resolution imagery (SPOT 5) to map industrial disturbances using the oil sands region of Alberta’s northeastern boreal forest as a case study. Key components of this study were (i) the development of additional spectral, texture, and geometrical descriptors for characterizing imageobjects (groups of alike pixels) and their contextual properties, and (ii) the introduction of decision trees with boosting to perform the object-based land cover classification. Results indicate that the approach achieved an overall accuracy of 88%, and that all descriptor groups provided relevant information for the classification. Despite challenges remaining (e.g., distinguishing between spectrally similar classes, or placing discrete boundaries), the approach was able to effectively delineate and classify fine-spatial resolution industrial disturbances.

SPOT5 imagery (left) and corresponding classification (right) for locations with (a) clearly defined industrial disturbances in a forest and shrub dominated landscape; (b) industrial disturbances in a bog and shrub dominated landscape; and (c) a fragmented landscape and many instances of industrial disturbances at various stages of recovery. The locations a1, b1, and c1 represent areas where there was confusion observed in identifying industrial disturbances.

SPOT5 imagery (left) and corresponding classification (right) for locations with (a) clearly defined industrial disturbances in a forest and shrub dominated landscape;
(b) industrial disturbances in a bog and shrub dominated landscape; and (c) a fragmented landscape and many instances of industrial disturbances at various stages of
recovery. The locations a1, b1, and c1 represent areas where there was confusion observed in identifying industrial disturbances.

Newer Posts »
Copyright © 2012-2025 Gang Chen, University of North Carolina at Charlotte. All rights reserved.
Skip to toolbar
  • Log In