With global warming and all of the impacts, it’s very important to constantly consider the question of time and space scales. May 2013 is a good example for those of us living in the Southeastern USA or North Carolina. Namely, North Carolina’s normal-to-cool spring is not at all indicative of how the global temperature is evolving. Let’s see how we can quickly use NOAA NCDC graphs to figure this out.
Global warming refers to the increase in average temperature of the entire Earth. The last part – the entire Earth – is the spatial scale. And that’s a huge spatial scale! When a scientist talks about global warming or that global warming has been detected, you have to step back and say WOW. What on Earth could warm an entire planet?  Over long time scales, of course there are a number of possible reasons (changes in the Sun, Earth’s orbital shape/proximity around the Sun, plate techtonics), but these take so long, they aren’t relevant to the concept of global warming. Even my statement that What on Earth could warm an entire planet? should be more precise and say something like What on Earth could warm an entire planet over a relatively short time period? The simplest, if somewhat incomplete, answer is the combination of greenhouse gases and aerosols emitted into the atmosphere from human activities. Period.
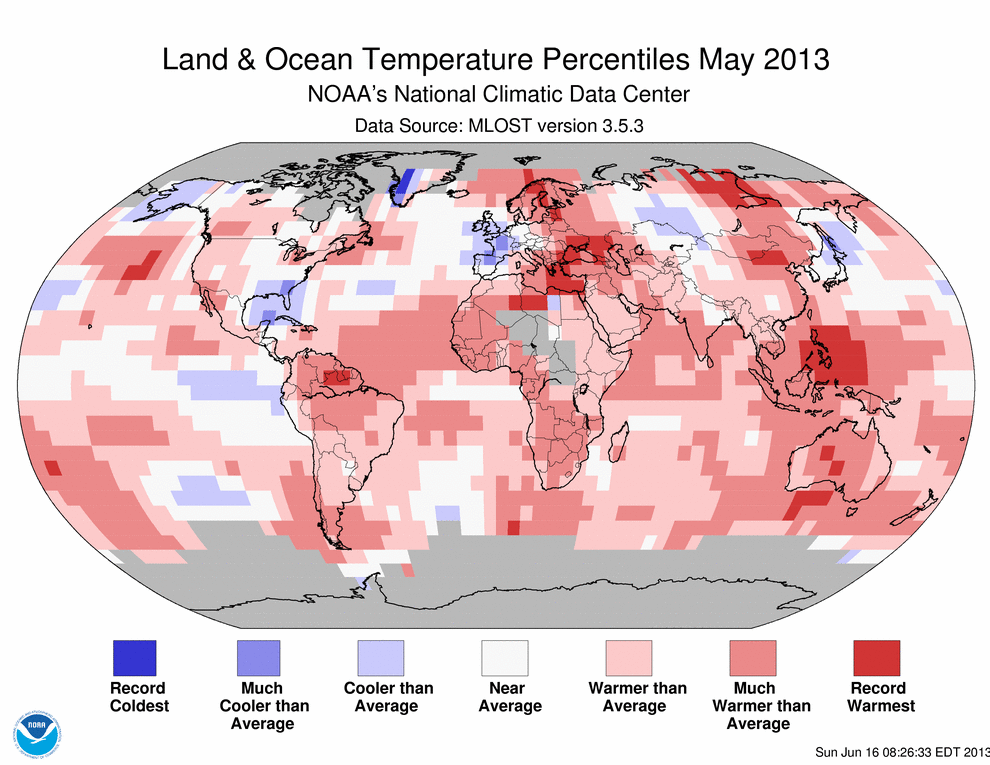
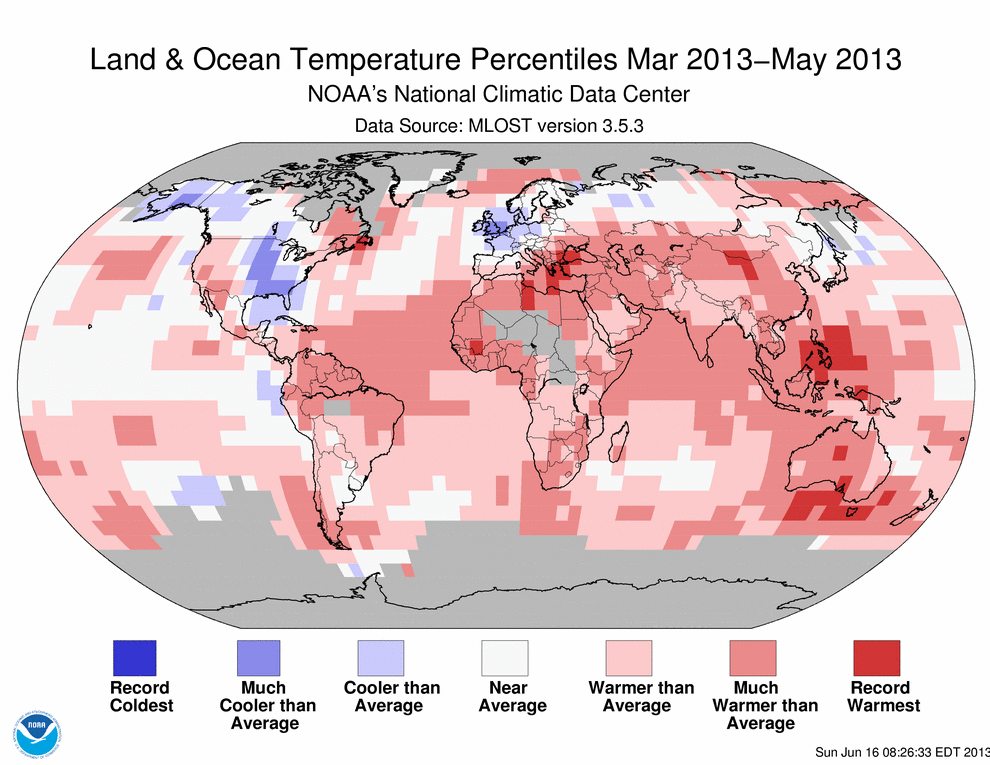
May 2013 analysis of global temperatures are trickling out. NOAA NCDC as always has a wonderfully complete report of climate news for May and for all previous months. My favorite part is the plethora of hyperlinks. NOAA NCDC should really be commended for their public outreach! Here is one of the figures from that webpage where you can see how different the Southeast USA is from the world in May 2013 – the world is shades of red, while the Southeast USA is shades of blue (cooler than normal). We’ve had a very pleasant spring in North Carolina. Pull back on the temporal (time) scale to see the March-April-May seasonal average
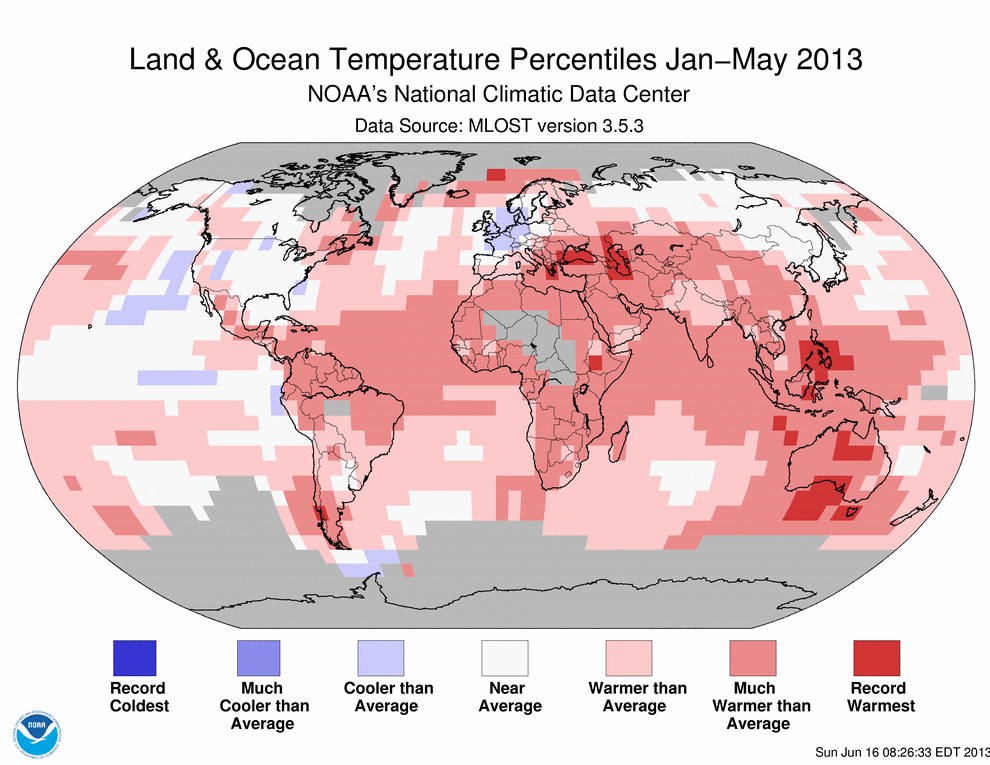
 and you can see that the cool spring extends well beyond May in terms of the anomaly. By this, I mean that the blues become deeper when you consider a three month period (March-April-May) and that implies without any quantitative work that March-April were more cooler-than-average. Pull back slightly further to the year-to-date rankings
 and here you see that the Southeastern USA and in fact most of the USA and even Alaska have been right at the climatological normal (which for NCDC is the average temperature from 1981-2010). The short story is that North Carolina below average temperatures for the period from January to May, March to May or just plain old May are not indicative of global temperatures. The real question is why?