In the great carbon cycle that is at work on our planet, carbon dioxide (CO2) gas concentration in our atmosphere, as measured in the most famous observation site in the world (Mauna Loa, Hawaii, home of the Keeling Curve), has risen again above 400 parts per million, or 400 ppm for short.  This happened in 2014 before CO2 dipped back below 400 ppm, and while 400 ppm is an arbitrary choice to focus on, round numbers typically get more attention than, say, 397 ppm. Think about a baseball player’s batting average, which is hits divided by at bats. Somehow a 0.299 (or “299”) batting average is perceived as worse than a 0.300 (300) batting average, but really, it’s the difference of a few hits (or at bats) in the course of a season. Ted Williams hit 406 in 1941. 185 hits in 456 at bats. 3 fewer hits, and he would have hit 399, and the world would’ve sighed. 3 hits! Back to CO2. I’ll suggest, like many others, that 400 ppm is a good place to step back and think.
What is the carbon cycle?
IPCC AR5 Figure 6.1 is a nearly perfect capture (as it should be given the expertise that developed the figure!), but I boiled away the beauty to a more practical figure for my classes. 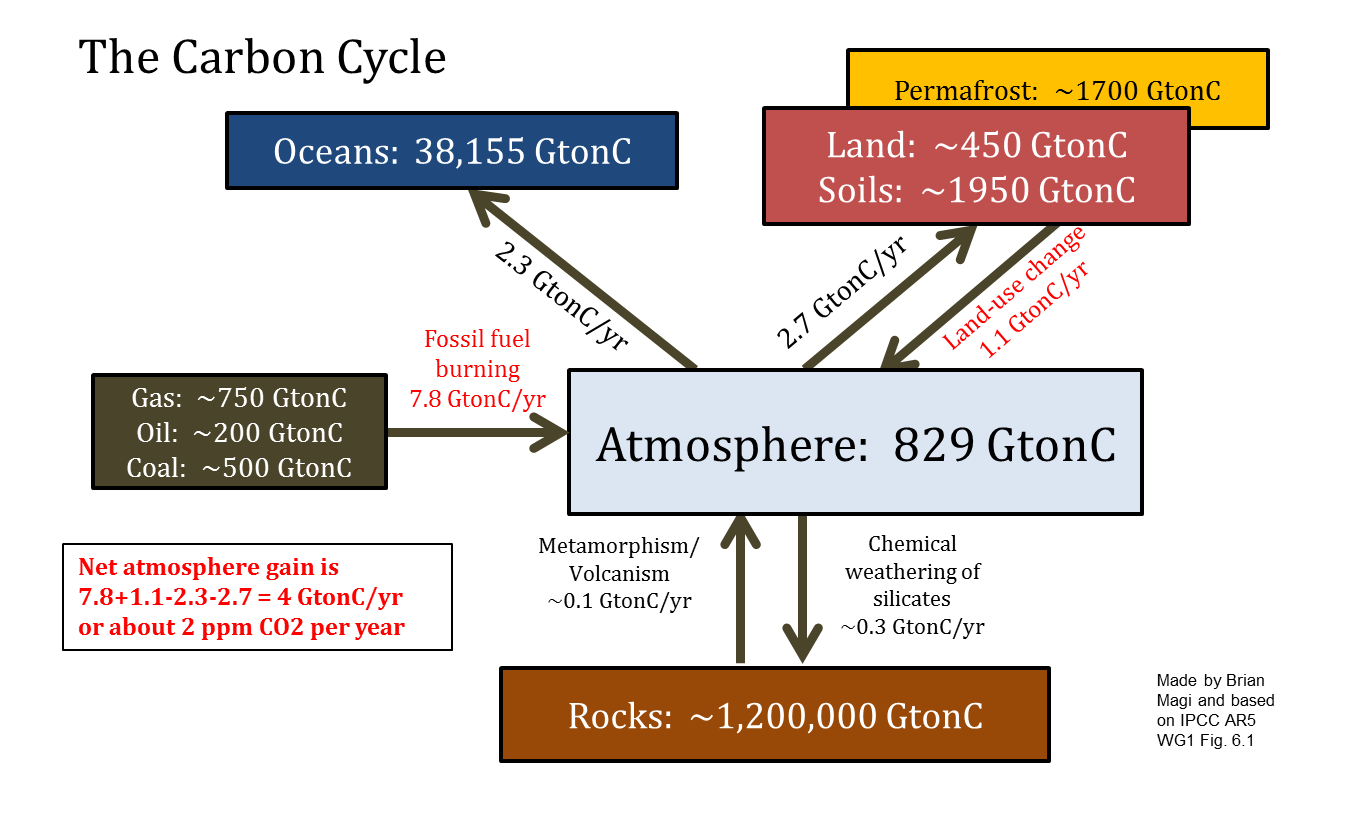 The reason that CO2 goes up and down in any given year is mainly because the Earth breathes in and out. When the Earth breathes in, plants draw CO2 from the air and convert it to plant carbon via photosynthesis. As a result CO2 concentration in the atmosphere goes down. When the Earth breathes out, plants release CO2 into the air via that respiration, the process of decomposition that acts in the opposite direction of photosynthesis. CO2 concentration in the atmosphere then goes up. The breath results in a steady rise in CO2 concentration from October to May, and a steady decrease from June to September. As you would expect, the rise and fall are essentially reversed in when they occur in the Southern Hemisphere, and this is evident in the data as well. As you might also surmise, in the Northern Hemisphere, the enormous number of seasonal plant growth/decay results in a bigger “breath” than in the Southern Hemisphere. Check the graph here to see that hemisphere difference.
The Keeling Curve, and CO2 concentration in general, is a way to “see” a part of the Earth’s carbon cycle, which are all the physical/chemical/biological/geological (biogeochemical, for short) processes that exchange carbon. The exchanges between carbon “reservoirs” (for example, the atmosphere and the land in the figure above) happen at different rates and magnitudes. Oceans store enormous amounts of carbon from CO2, and rocks store even more. The atmosphere is relatively carbon-free, but we are burning carbon from rock reservoirs (fossil fuels), and burning is a combustion chemical reaction that produces many carbon-containing gases and particles, but most fundamentally water vapor and CO2. This CO2 goes into the atmosphere and stays there for a long time. Water vapor goes into the atmosphere too, but leaves the atmosphere within a couple of weeks via precipitation. As a result, the year to year variability shows the Earth’s breath (land-atmosphere exchange), but the long-term trend shows that CO2 concentration itself is increasing when you compare the average from one year to one from a previous year. That long-term trend is showing how more and more carbon from CO2 is being stored in the atmosphere reservoir of the carbon cycle.
We are FORCING the carbon cycle to change by changing the amount of carbon in the atmosphere. That 400 ppm concentration value is a measure of how much carbon from CO2 (in units of mass, like kilograms or pounds) is in the atmosphere. The change in concentration is a measure of how much carbon from CO2 has been put into the atmosphere (again, in units of mass). The pre-industrial concentration of CO2 was about 280 ppm, so 120 ppm has been added to the atmosphere reservoir in the carbon cycle. It’s relatively easy to show that +120 ppm is equal to 284 billion tons of carbon added to our atmosphere.
Most of that 120 ppm is from human activities of fossil fuel burning (moving carbon from rock reservoir) and from deforestation (moving carbon from land reservoir), and 400 ppm is, as far as humans are concerned, completely unprecedented. 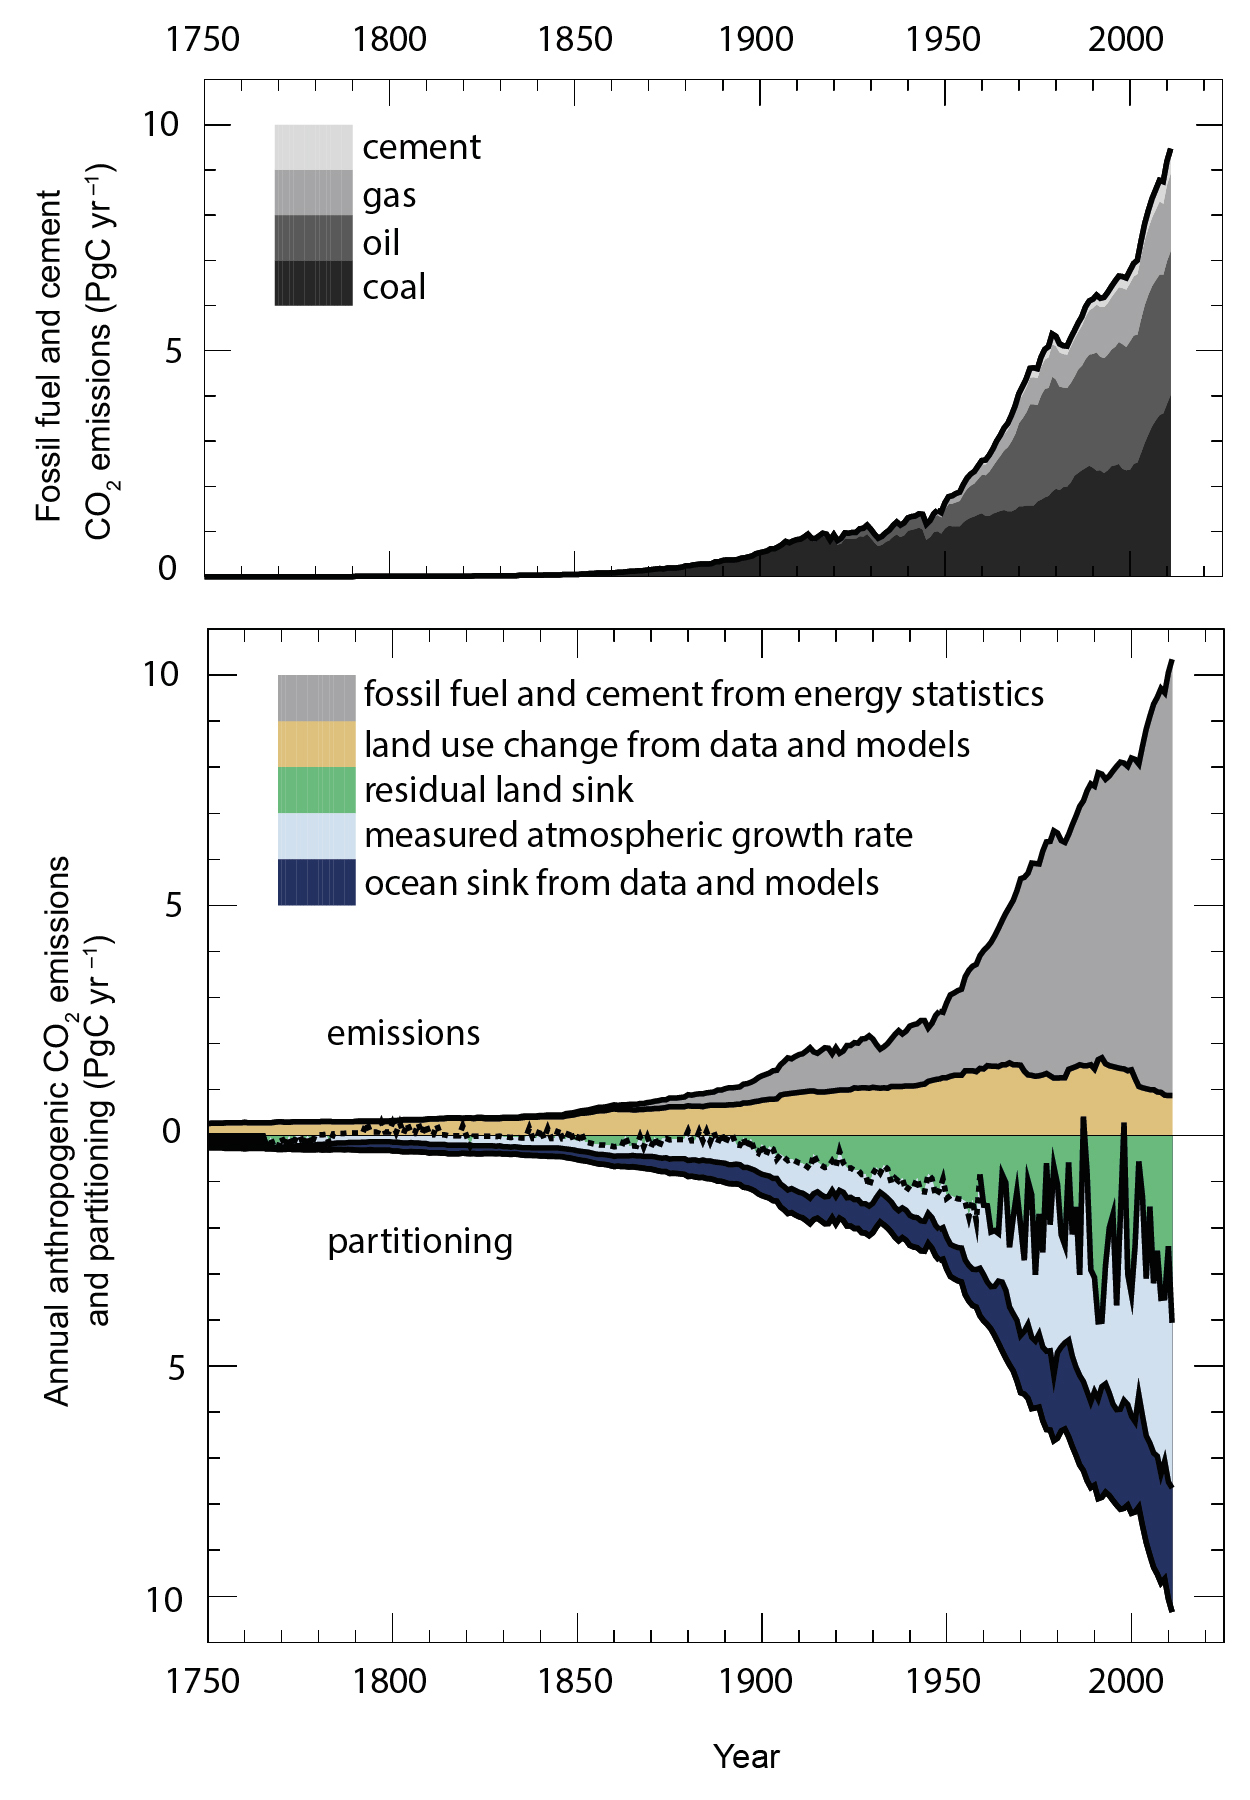 At no time in the past 800,000 years, through several ice ages and enormous climate changes (figure at bottom), has the planet had concentrations of anything close to 400 ppm. Furthermore, it is quite clear from scientific and anthropologic evidence (at least!) that human civilization has evolved in a period of relative stability in Earth’s climate history. CO2 concentration has largely remained around 280 ppm until the last 100 years or so. Evidence that scientists have collected suggest that CO2 and temperature track each other. This is fundamentally why most climate scientists, and most scientists in general, are concerned about short and long term futures.
Humans can adapt and we will have to adapt to some degree, but the changes we are imposing on the planet through the carbon cycle are much faster than anything that we have an analog for in the past through naturally-driven climate changes. This is where carbon mitigation strategies are so critical, and why everyone is talking about the EPA Clean Power Plan, COP20 Lima, China-USA negotiations, and the upcoming COP21 Paris negotiations. These negotiations are about whether humans can live on the world without altering it in ways that more than likely is detrimental before being beneficial. Right now, the science says we are not very good tenants. With 400 ppm CO2, we are breathing air with more CO2 in it than any other human or proto-human has ever breathed. It’s not poisoning us directly, but the increased CO2 is changing how the Sun and Earth-Atmosphere system are interacting with each other. We are forcing the planet to warm as more electromagnetic radiation is absorbed by the unusual excess of greenhouse gases in the atmosphere. The warmth is changing everything, and it will continue.
