data analysis

Climate change and 400 ppm carbon dioxide

In the great carbon cycle that is at work on our planet, carbon dioxide (CO2) gas concentration in our atmosphere, as measured in the most famous observation site in the world (Mauna Loa, Hawaii, home of the Keeling Curve), has risen again above 400 parts per million, or 400 ppm for short. mlo_two_years-2015-01-12This happened in 2014 before CO2 dipped back below 400 ppm, and while 400 ppm is an arbitrary choice to focus on, round numbers typically get more attention than, say, 397 ppm. Think about a baseball player’s batting average, which is hits divided by at bats. Somehow a 0.299 (or “299”) batting average is perceived as worse than a 0.300 (300) batting average, but really, it’s the difference of a few hits (or at bats) in the course of a season. Ted Williams hit 406 in 1941. 185 hits in 456 at bats. 3 fewer hits, and he would have hit 399, and the world would’ve sighed. 3 hits! Back to CO2. I’ll suggest, like many others, that 400 ppm is a good place to step back and think.

What is the carbon cycle?

IPCC AR5 Figure 6.1 is a nearly perfect capture (as it should be given the expertise that developed the figure!), but I boiled away the beauty to a more practical figure for my classes. carbon-cycle-boiled The reason that CO2 goes up and down in any given year is mainly because the Earth breathes in and out. When the Earth breathes in, plants draw CO2 from the air and convert it to plant carbon via photosynthesis. As a result CO2 concentration in the atmosphere goes down. When the Earth breathes out, plants release CO2 into the air via that respiration, the process of decomposition that acts in the opposite direction of photosynthesis. CO2 concentration in the atmosphere then goes up. The breath results in a steady rise in CO2 concentration from October to May, and a steady decrease from June to September. As you would expect, the rise and fall are essentially reversed in when they occur in the Southern Hemisphere, and this is evident in the data as well. As you might also surmise, in the Northern Hemisphere, the enormous number of seasonal plant growth/decay results in a bigger “breath” than in the Southern Hemisphere. Check the graph here to see that hemisphere difference.
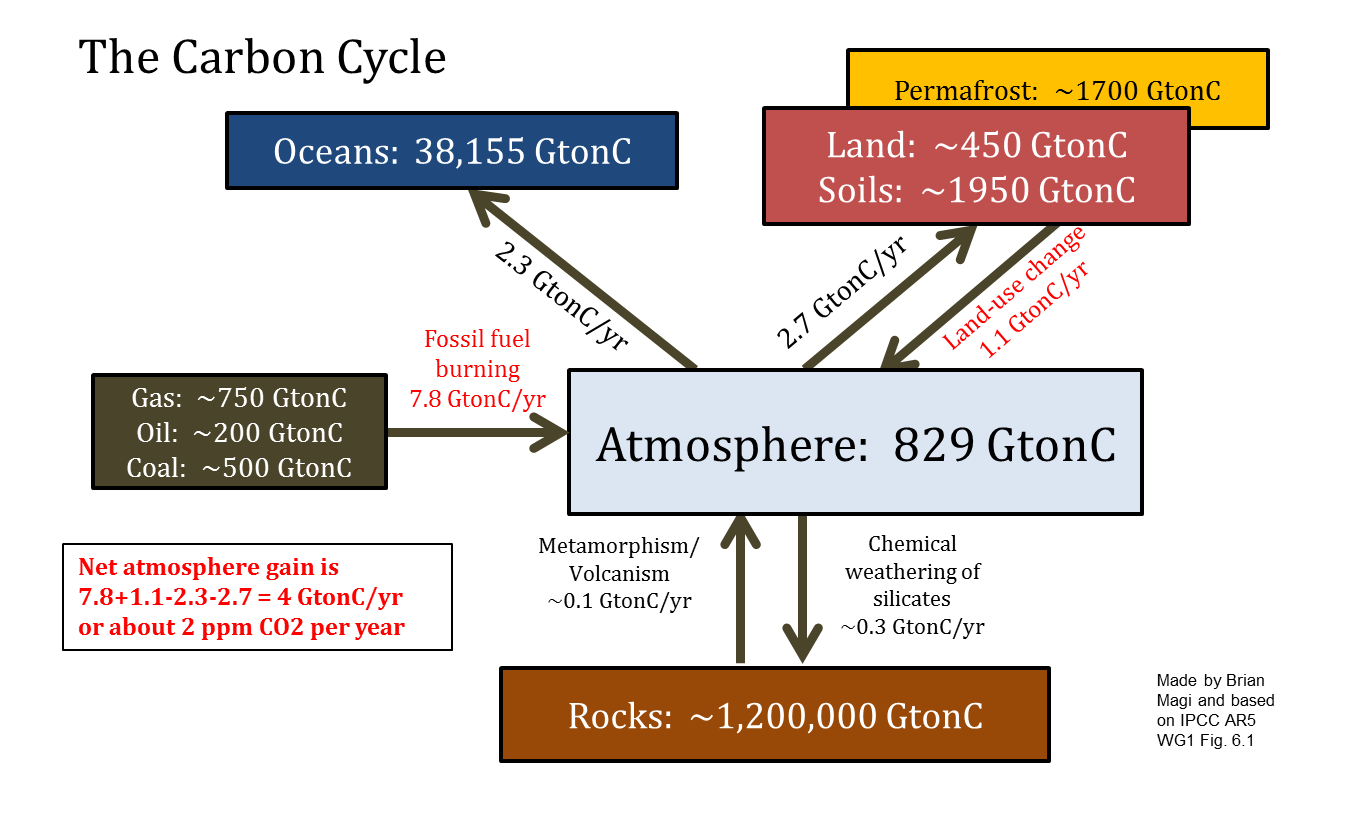
The Keeling Curve, and CO2 concentration in general, is a way to “see” a part of the Earth’s carbon cycle, which are all the physical/chemical/biological/geological (biogeochemical, for short) processes that exchange carbon. The exchanges between carbon “reservoirs” (for example, the atmosphere and the land in the figure above) happen at different rates and magnitudes. Oceans store enormous amounts of carbon from CO2, and rocks store even more. The atmosphere is relatively carbon-free, but we are burning carbon from rock reservoirs (fossil fuels), and burning is a combustion chemical reaction that produces many carbon-containing gases and particles, but most fundamentally water vapor and CO2. This CO2 goes into the atmosphere and stays there for a long time. Water vapor goes into the atmosphere too, but leaves the atmosphere within a couple of weeks via precipitation. As a result, the year to year variability shows the Earth’s breath (land-atmosphere exchange), but the long-term trend shows that CO2 concentration itself is increasing when you compare the average from one year to one from a previous year. That long-term trend is showing how more and more carbon from CO2 is being stored in the atmosphere reservoir of the carbon cycle.

We are FORCING the carbon cycle to change by changing the amount of carbon in the atmosphere. That 400 ppm concentration value is a measure of how much carbon from CO2 (in units of mass, like kilograms or pounds) is in the atmosphere. The change in concentration is a measure of how much carbon from CO2 has been put into the atmosphere (again, in units of mass). The pre-industrial concentration of CO2 was about 280 ppm, so 120 ppm has been added to the atmosphere reservoir in the carbon cycle. It’s relatively easy to show that +120 ppm is equal to 284 billion tons of carbon added to our atmosphere.

Most of that 120 ppm is from human activities of fossil fuel burning (moving carbon from rock reservoir) and from deforestation (moving carbon from land reservoir), and 400 ppm is, as far as humans are concerned, completely unprecedented. ipcc-ar5-wg1-Fig6-08 At no time in the past 800,000 years, through several ice ages and enormous climate changes (figure at bottom), has the planet had concentrations of anything close to 400 ppm. Furthermore, it is quite clear from scientific and anthropologic evidence (at least!) that human civilization has evolved in a period of relative stability in Earth’s climate history. CO2 concentration has largely remained around 280 ppm until the last 100 years or so. Evidence that scientists have collected suggest that CO2 and temperature track each other. This is fundamentally why most climate scientists, and most scientists in general, are concerned about short and long term futures.
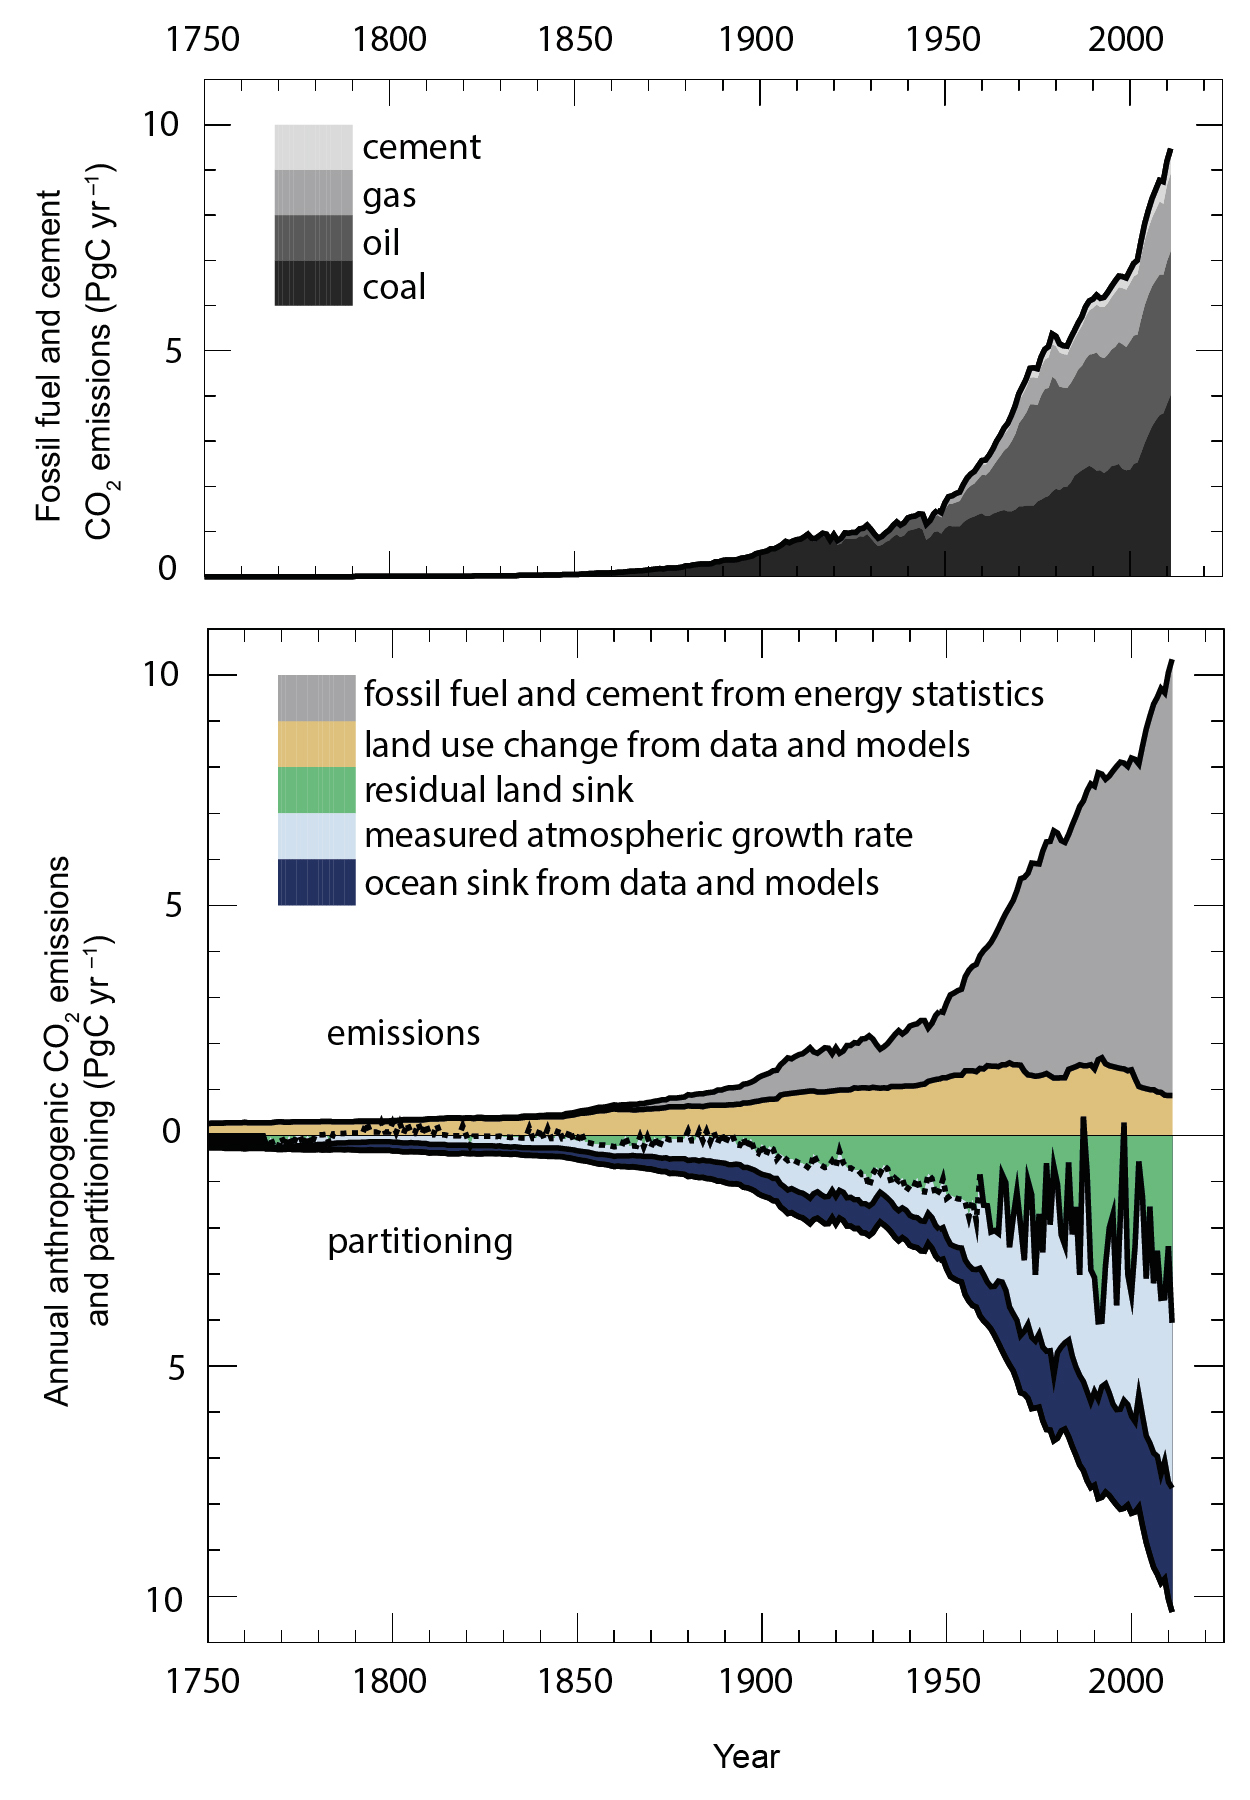
Humans can adapt and we will have to adapt to some degree, but the changes we are imposing on the planet through the carbon cycle are much faster than anything that we have an analog for in the past through naturally-driven climate changes. This is where carbon mitigation strategies are so critical, and why everyone is talking about the EPA Clean Power Plan, COP20 Lima, China-USA negotiations, and the upcoming COP21 Paris negotiations. These negotiations are about whether humans can live on the world without altering it in ways that more than likely is detrimental before being beneficial. Right now, the science says we are not very good tenants. With 400 ppm CO2, we are breathing air with more CO2 in it than any other human or proto-human has ever breathed. It’s not poisoning us directly, but the increased CO2 is changing how the Sun and Earth-Atmosphere system are interacting with each other. We are forcing the planet to warm as more electromagnetic radiation is absorbed by the unusual excess of greenhouse gases in the atmosphere. The warmth is changing everything, and it will continue.
co2-800k-present

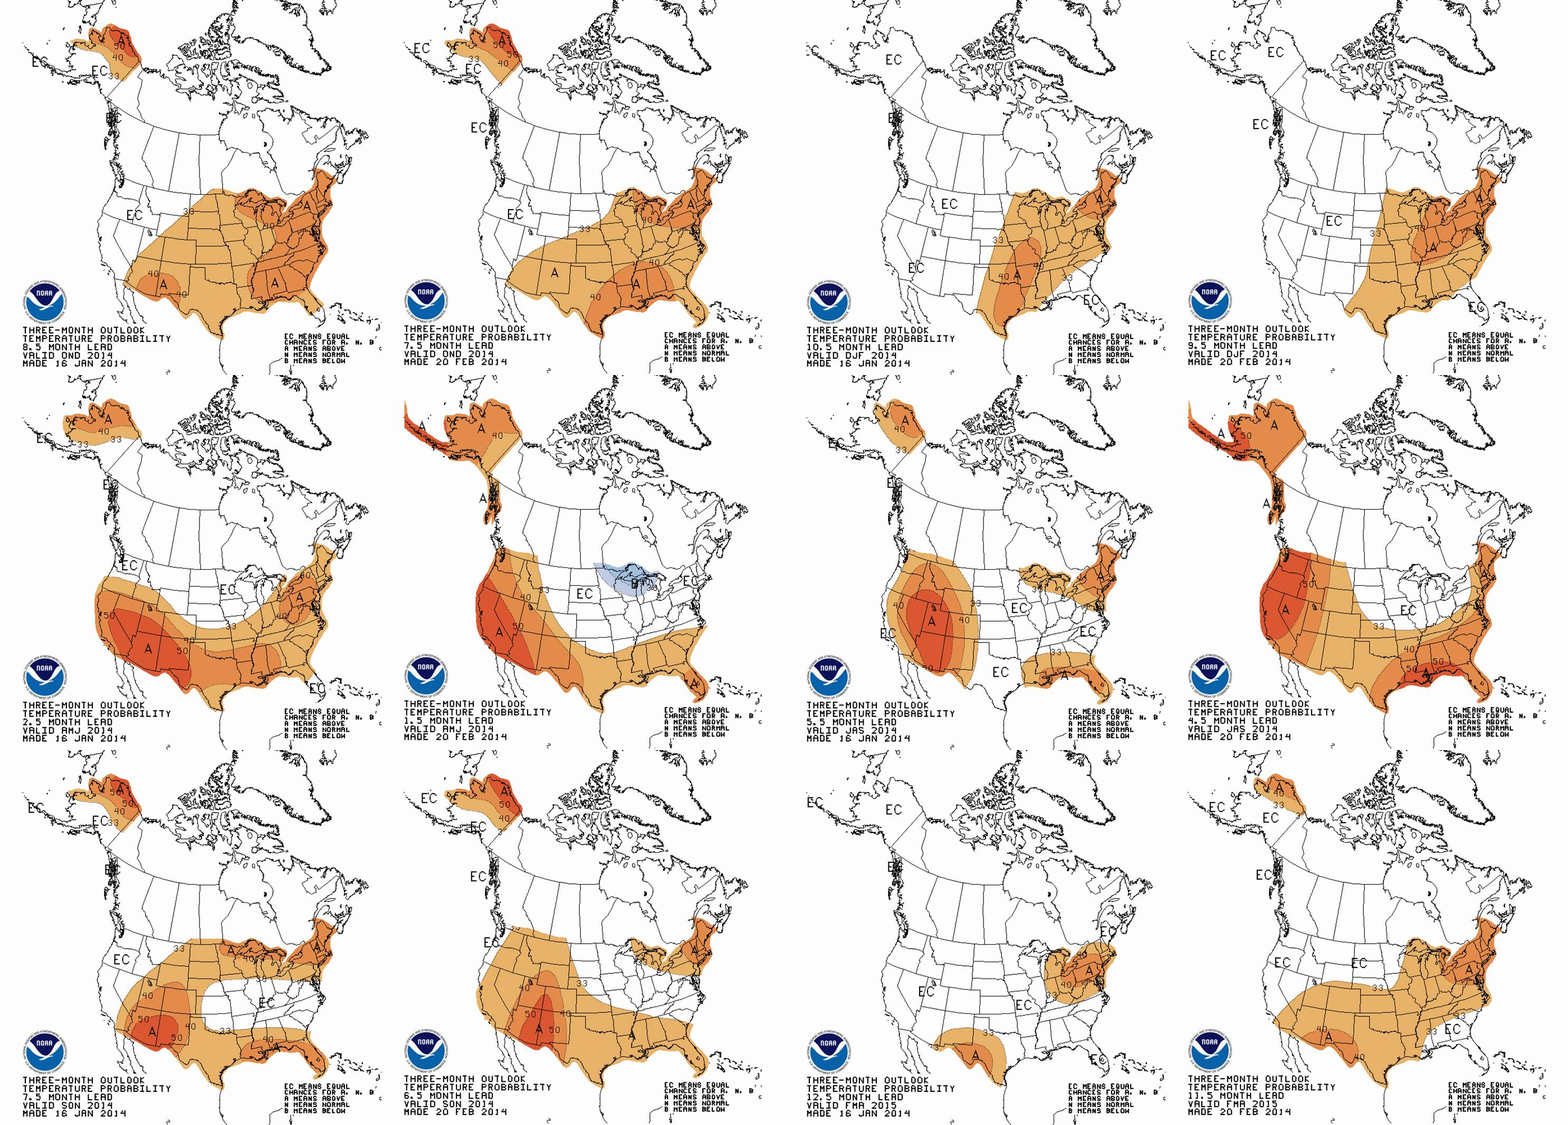
Robust features in the 2014 USA forecast

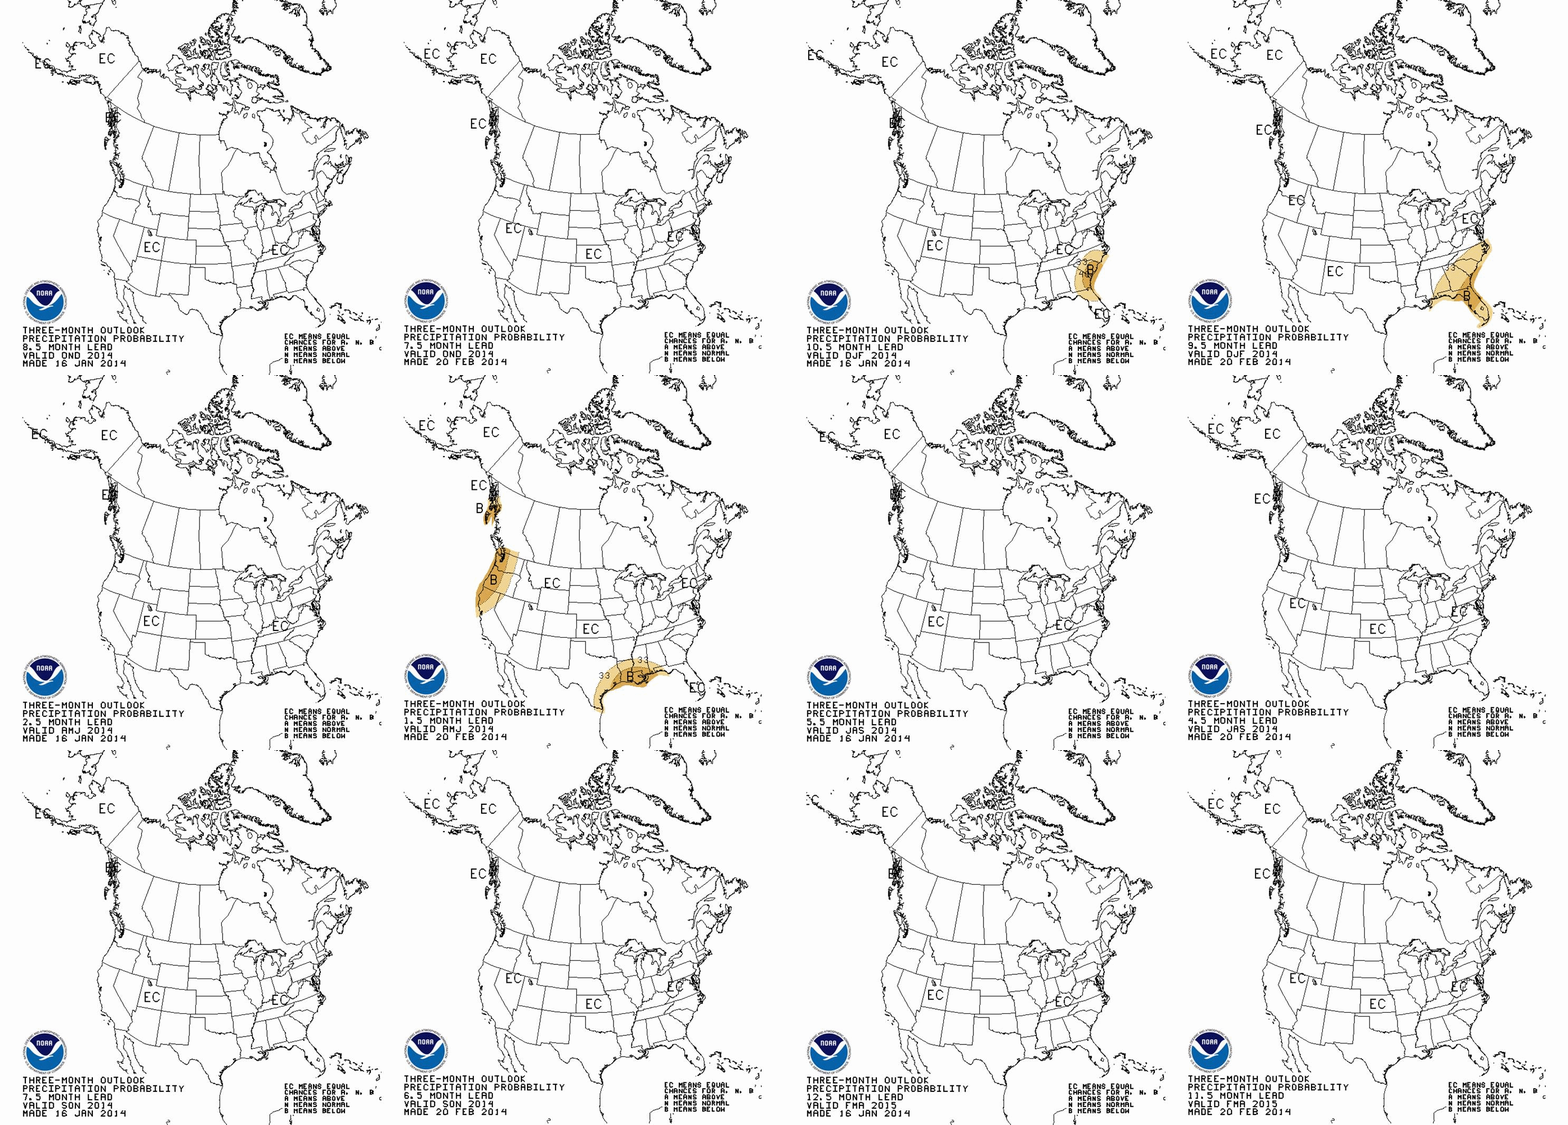
Building on a previous discussion about a seasonal forecast product from NOAA Climate Prediction Center (CPC), I am still really curious about how robust the features in the seasonal weather patterns in the USA are. “Weather” in this case is referring to temperature and precipitation (T and PCP), and features refer to 3-month boxcar averages of T and PCP anomalies compared to the corresponding 3-month climatologies. So this is not the normal day-to-day weather or even the recent weather. Here are some new figures, which I explore below in terms of features that seem to be “robust” and features that seems to be “ephemeral”.

First, temperature in two plots:

comparisons-2014-3-start

Then, precipitation in two plots:

comparisons-precipitation-2014-3-startWatch the figures carefully. All the animations start with a forecast for 3-month averaged T and PCP for March-April-May (MAM). Then, they step forward to April-May-June (AMJ)The CPC data product seems intended to provide an idea of whether T and PCP will be above or below average for the USA (including Alaska). In a previous discussion, I looked at CPC outlooks for 2014 and early 2015, and their figures and analysis were produced using actual mid-January 2014 conditions.
New data

Now another month of data is in and CPC has updated their seasonal forecast to begin with mid-February 2014 conditions. A natural expectation is that the seasonal forecast would be better earlier in the overall forecast period. In other words, as the animation above progresses, the confidence in the forecast should decrease with time. Sometimes, however, larger patterns of atmospheric variability that emerge somewhere else in the world can exert some level of control on weather patterns (T and PCP) in the USA. El Nino-Southern Oscillation (ENSO, or sometimes just “El Nino”) is the best known example.

There could be all sorts of speculative lines of thinking in terms of causes, so for now, I’ll focus on the features that seem to hold up after another month of data. I’ll call these robust, and point out one overall theme that is worth watching as winter releases its grip on much of the USA.

Robust Features

The Southwestern USA and often the Western USA in general is facing what will likely be a warmer than average year until about October. I think this is a pretty safe prediction. There is almost no evolution after more data was considered, except perhaps that the Pacific Coast tends towards higher probability of above average warmth. Upper Alaska is also holding up to the earlier forecast of warmth, especially in the northernmnost reaches. Both these regions are well known as fire prone under unusual warmth. Uh-oh. By November-December, the above average warmth shifts to the mid-Atlantic and the Southeast USA. The Northeast USA drifts towards unusual warmth starting in the summertime, maybe July, and ending about, oh, early next calendar year. For precipitation, much of the USA seems to be a normal water year. The problem is that in the near term, California remains dryer than average. Other features in a featureless prediction are that the deep South is dry in the spring, while the Ohio River Valley is wetter than average. Northern Florida and the coastal SE USA tend towards dry late in the calendar year.*

Summary and What the AVERAGE Year Looks Like

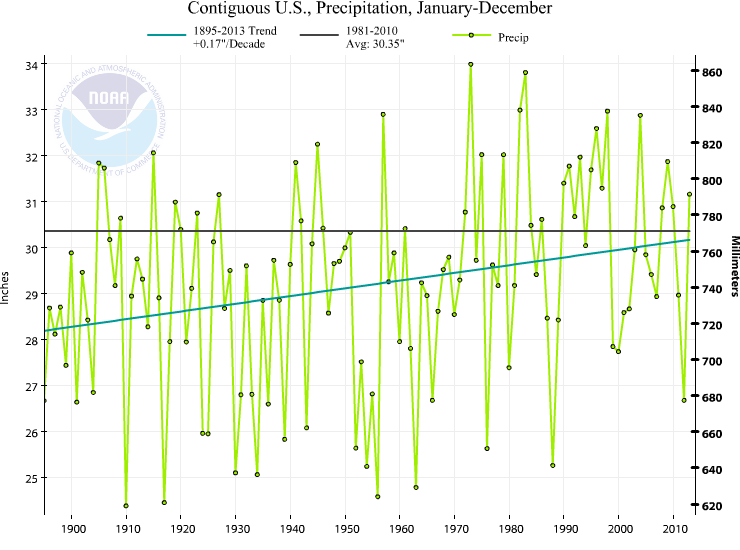
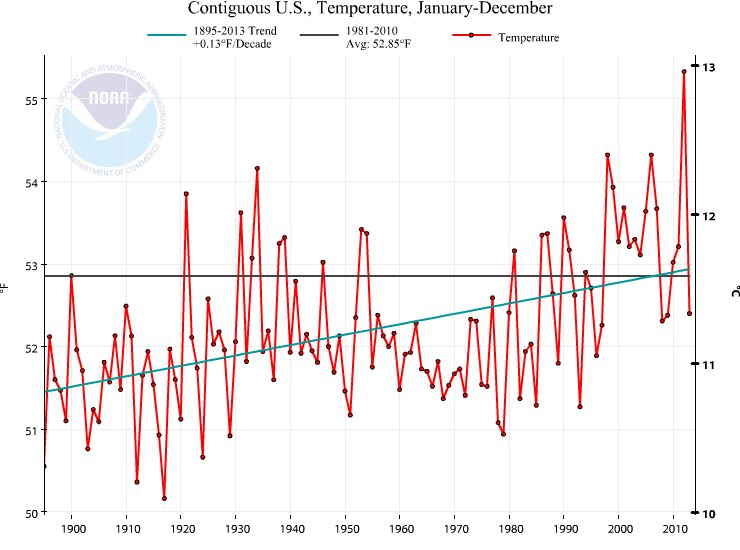
Overall, the story remains clear: The USA should experience another warmer than average year. Warmer than average is a relative term. Remember that NOAA (and CPC) define the normal temperature and precipitation amounts by the 1981-2010 30 year average. This is a particularly irritating 30 year timeframe mainly because climate is clearly warming most rapidly during the 1970 to present day period. It is what it is, but sometimes the simpler message is lost. The CPC forecast is for a year that is warmer than the 1981-2010 average. So what is the 1981-2010 average?? This is what the 1895-2013 temperature and precipitation trends for the contiguous USA (no Alaska) from NOAA NCDC with the baseline average 1981-2010 average temperature overlaid.contiguousUSA-1895-2013-annual-TcontiguousUSA-1895-2013-annual-PThe precipitation is not the story, in my mind. The story is that we should expect a warmer than 1981-2010 year. The average of 1981-2010, without doing any math, is clearly warmer than most of the years this past century. Quickly eyeballing this number says that 82 of the 100 years in the last century are colder than the 1981-2010 average. This is really important in terms of perception of the significance of a warmer than “average” year. 1981-2010 is not a very good choice for the “average”. Gonna be a warm year according to CPC. Nowhere is there a robust and spatially significant feature suggesting below average temperatures, by the way.
*There are a few features that are not that robust, by my admittedly weak definition. For example, it’s not that clear whether the NE USA or the NW USA will tend warmer than average in the early summer. And precipitation has about the same number of features that are robust as not robust.

Ramping up for teaching with NOAA NCDC

Summer is a time of dedicated research for me. Finished one project, waiting for peer reviews on that manuscript, tinkering with twitter, planning out research conference travel in the next school year, and working on a grant proposal to NSF. The season of the classroom is nearly here though, so I’m slowly re-allocating my hours to teaching. A great early-career workshop for university and college faculty that I attended the last week of July helped me get into gear with teaching again. I need a workshop like that every summer!

Another way I start to think about teaching is to begin to browse through the data that I want to bring into the classroom. One site I haven’t visited in months, but that I prolifically visit throughout past school years, is the NOAA NCDC time series plotter. I had the pleasure of visiting the numbers again tonight and remain very impressed by NCDC outreach and transparency efforts. The new addition to the time-series plotter (which you can use to produce climate-relevant analysis at different spatial and temporal scales) is a slightly more friendly user-interface, and a few features that I think most stats people will really appreciate. Yes, it’s not a super fancy analysis package, but the statistical analysis you can do just via the webpage now includes two new options. One is the option to display the anomaly against a different base period rather than always using the 20th Century average. In other words, you can choose a base period of 1951-1980 like NASA GISS tends to use or you can play around and see what the effect of a different base period is. The other new option is a display of a trend line for any period. The first thing you can do with this is see how temperature (for example) trends in the early part of the century compare to the trends in the latter part of the century. Or you can mimic the cherry picking that climate data is sometimes a victim to and choose very specific start and end points to produce a trend that amplifies an argument you are making (“look, it’s getting colder!” or “look, it heating up super fast”). one exception to all this great online analysis is that it only applies at the “super” level for data in the contiguous USA. someday, i’ll ask NCDC scientists why this can’t be done for Alaska and Hawaii, and why the global analysis tools are more limited. either way, an exciting development in my virtual friendship with NOAA NCDC.

Beijing air quality and agricultural fires

As I browsed through my favorite twitter feeds which includes @BeijingAir and the other US Embassies, I saw there was some really really poor air quality in Beijing. The US Embassies in China tweet particulate matter 2.5 (PM2.5) concentrations in the atmosphere on an hourly basis and also provide 24 hour average PM2.5 per the (USA) EPA regulatory methods. Namely, 24 hour PM2.5 is what’s regulated by the EPA in our country, and since US Embassies are US territory (as I understand it from The Simpsons Bart vs Australia episode), then US-relevant metrics are tweeted in addition to the hourly data. I tweeted about the very poor air quality in Beijing today

and

The second tweet was an tribute to an Onion article saying something like EPA tells people to stop breathing but I couldn’t find a link. Ok. So after I sent out that 2nd tweet, I began to wonder: What the heck is going on in Beijing? PM2.5 is above 400 ug/m3* for hours on end during the day and the 24 hour average PM2.5 just got tweeted as nearly 300 ug/m3. This is extremely hazardous, both on the EPA scale of Air Quality Index (AQI) and on the scale of I-Cannot-Breathe-Long-Enough-To-Finish-This-Sente… (no link to that scale). As the title of the post implies, the answer is related to burning practices – and I think it’s worth more that a couple of tweets. I’m asserting that the main problem is emissions from local/regional agricultural fires. This touches on my own research into fires and the peculiar human-influenced fire seasonality as a function of where you are in the world. Now, take it easy, I tell myself. Why? Every scientist loves to talk about science, but we especially love talking about our own research. I’ll try not to go on and on, is what I’m saying.

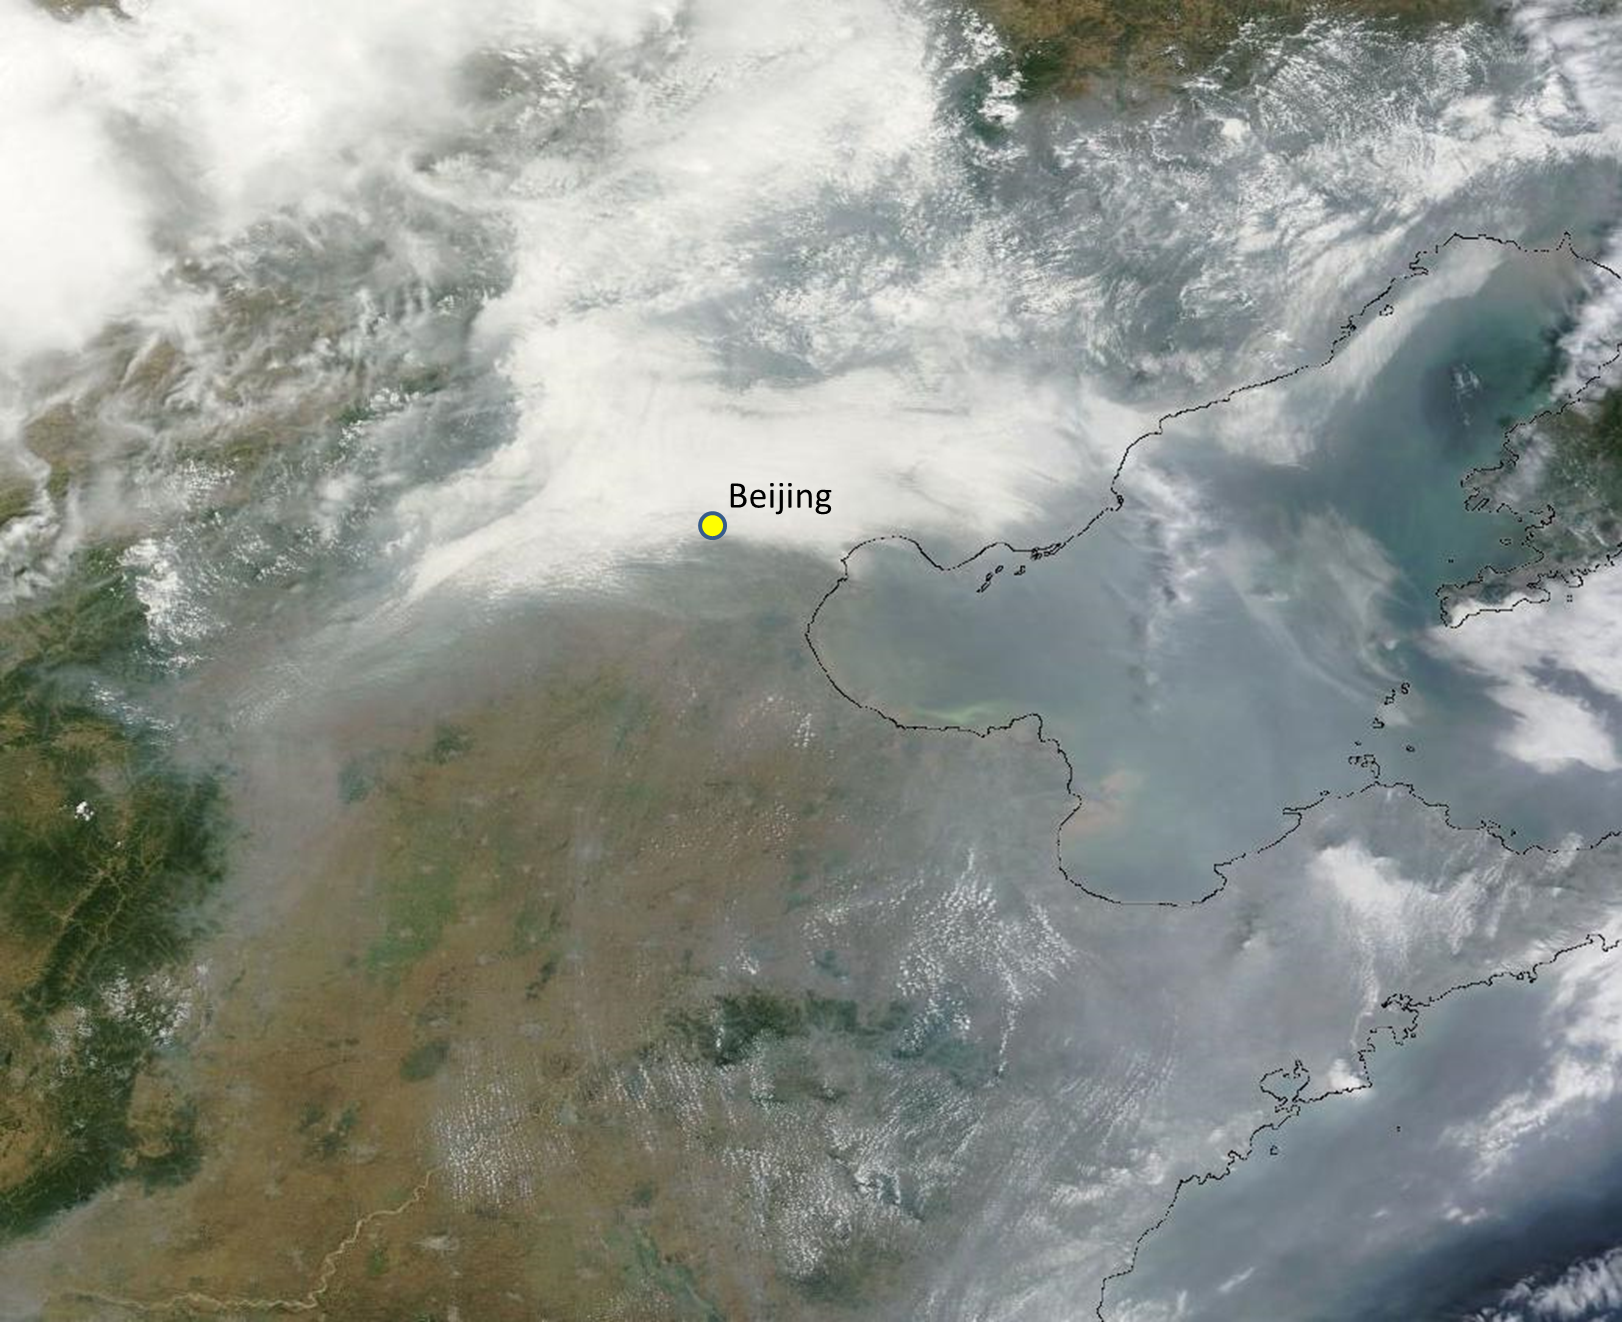
How can we do a first-order (read as “informal”) test of this hypothesis? First, let’s check satellites. There is some very accessible information from NASA that can be used to study problems that aren’t in the data-rich part of the world or in the parts of the world where I don’t even know what the characters are for “fire”. NASA has a satellite called Terra reporting data since November 2000. From this page, I googled the lat-lon of Beijing (40 N, 116 E) and created my own custom satellite image of Eastern China with the approximate location of Beijing marked.

Satellite image from MODIS sensor on the NASA Terra satellite for June 28 2013.  Beijing location is approximate.

Satellite image from MODIS sensor on the NASA Terra satellite for June 28 2013. Beijing location is approximate.

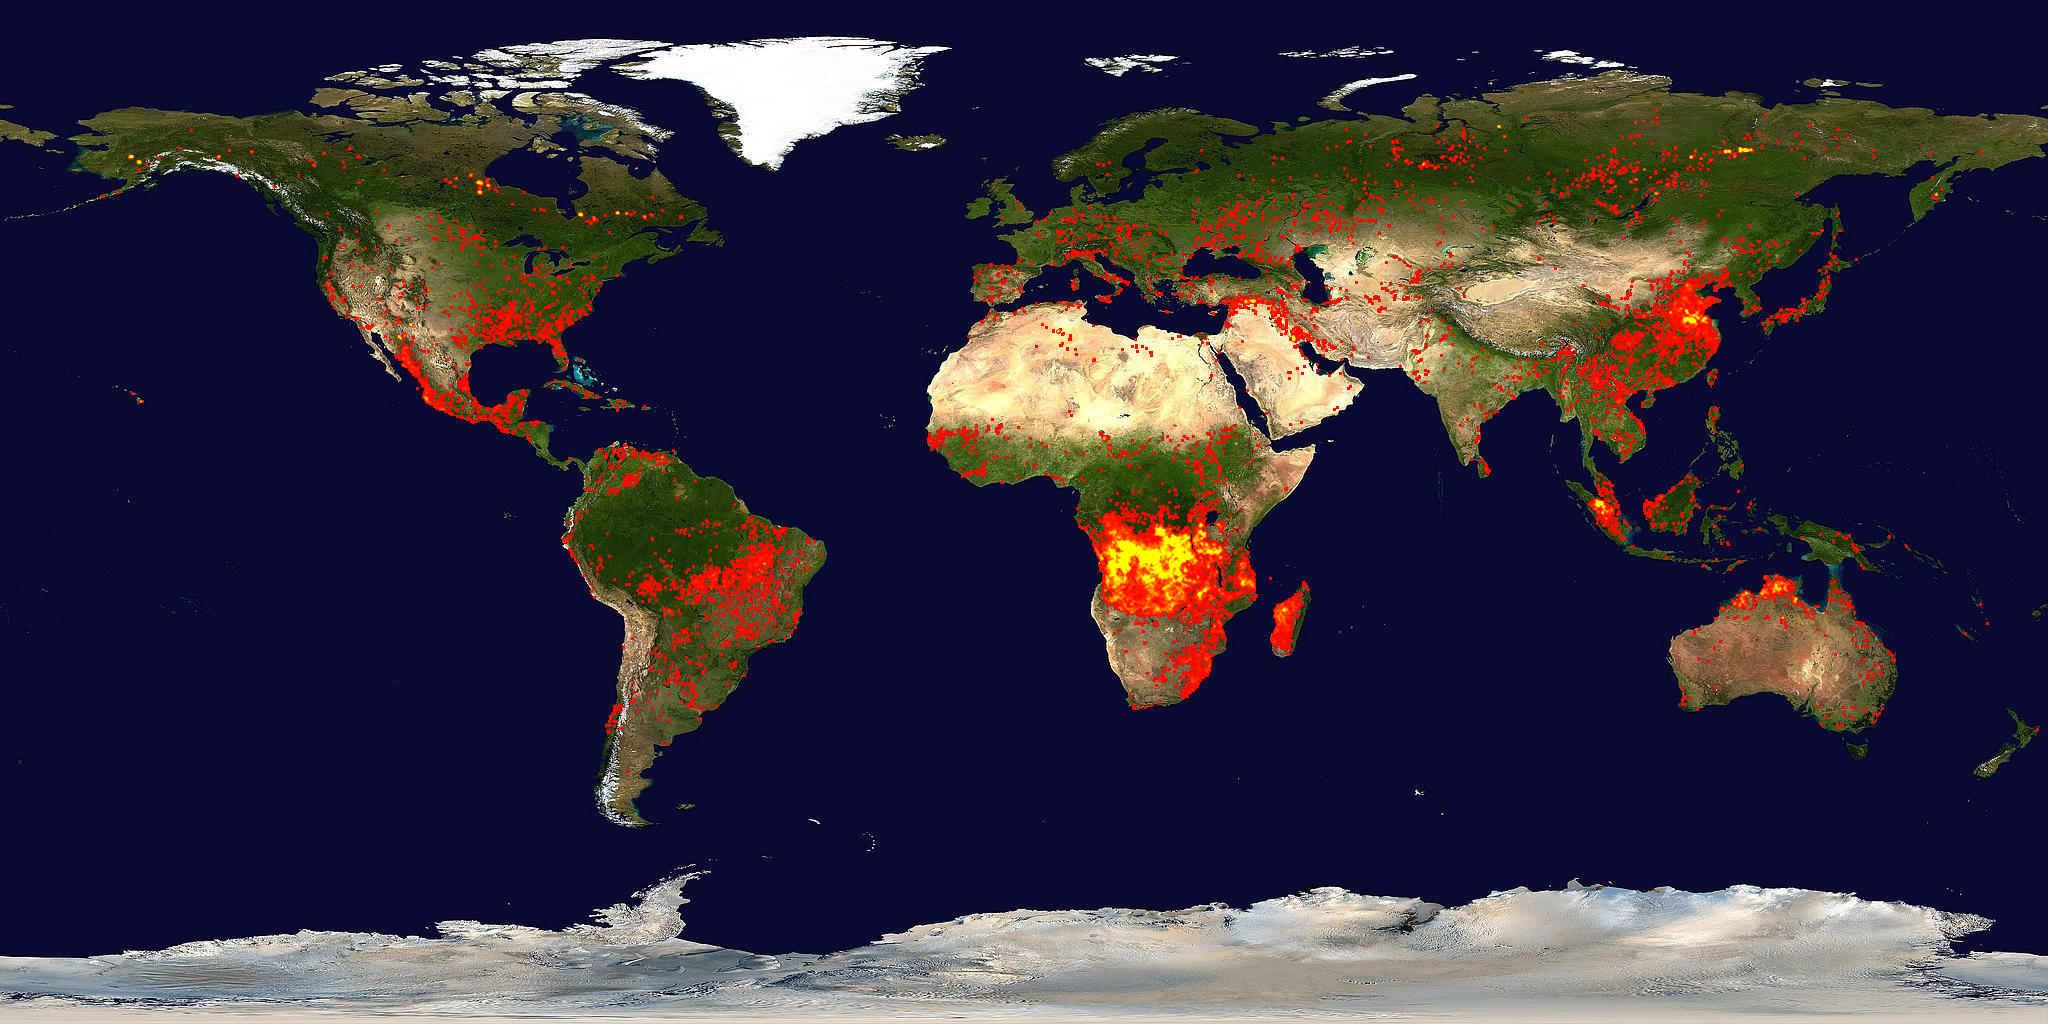
Right away, you see there are clouds. But there are also signs of gray-ish haze very similar to my research page header up at the top (smoke pouring off of southern Africa). So smoke is a distinct possibility. Now we can use data from the same NASA satellite (Terra) and same sensor (MODIS) but using a different wavelength of electromagnetic radiation. Namely, the parts that we feel/sense as heat – or thermal infrared radiation. Turns out, NASA has a whole team of scientists looking at this data and there is a data product called the Thermal Anomaly product. Something more “operational” (meaning it’s available at a semi-regular and rapidly updated way, like weather data is for weather forecasting models) for global fires is available at the same NASA website as I used to get the image above. Here’s the global view of fires
Global fire activity from the last 10 days ending on June 28 2013.

Global fire activity from the last 10 days ending on June 28 2013.

Clearly, fires are active in Eastern China – so we’re almost at the bottom of the mystery of why @BeijingAir is not the place for breathing deeply right now. You can download a map file showing fires from the last 48 hours for different regions by going to the KML tab and opening the KML file in Google Earth. I downloaded the “Russia and Asia” KML file and produced this
Active fires from the MODIS sensor on the NASA Terra for the 48 hours ending on June 28 2013.

Active fires from the MODIS sensor on the NASA Terra for the 48 hours ending on June 28 2013.

where you can see that my Google Earth has the Beijing Embassy location saved as a placemark. Regardless of the clouds, the pollution from the fires is certainly pouring into the atmosphere over Beijing and affecting surface air quality to the point that the AQI values are nearly off the scale again, but this time, it is not because of the combination of meteorology and emissions from fossil fuel consumption.

The winter and spring months – the months related to the very poor air quality referred to in the report above and here – are plagued by deep near surface temperature inversions that act to inhibit mixing. What does this mean? Well, if pollution is emitted from cars and factories in Beijing in the winter-spring, it will tend to stay in the first 500 meters (1800 ft) above the ground – roughly. The pollution gets trapped. On a day without a temperature inversion, the pollutants emitted are probably about the same, but mix into a much deeper atmosphere (say about 2000-3000 meters, or about 4-6 times deeper layer). The pollution is thus more dilute. I haven’t checked meteorology in the case of todays very poor air quality, but I suspect the effect of meteorology (even if mixing is deep and efficient) is overwhelmed by the emissions from all the fires southeast of Beijing.

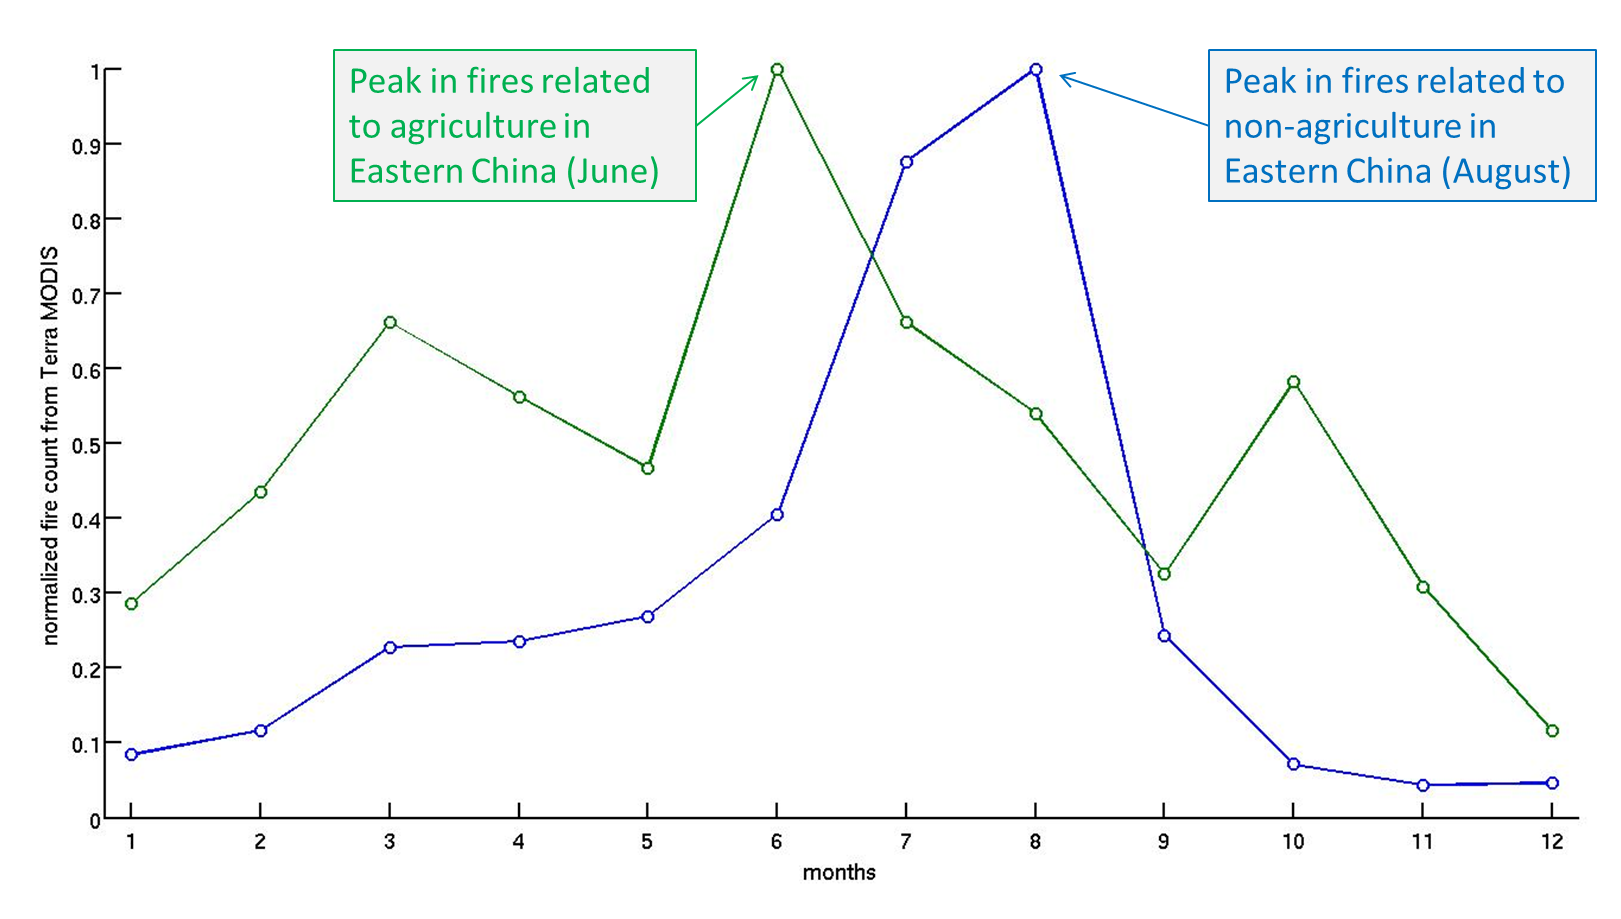
What kind of fires? Or why are they burning? Great question! Are these forest fires like the lightning-triggered fires plaguing the Western USA right now? No! When you mask out the Terra MODIS fire data in a way that you only look at data from land that is mostly cropland (agriculture) in Eastern China, then you find something related to our findings in the Biogeosciences paper.

Fire season for land that is mostly agriculture (cropland in Eastern China) and land that is mostly non-agriculture (forests, grasslands).  This is based on the average over 10 years of data from MODIS.  More analysis like this in the link to my paper below.

Fire season for land that is mostly agriculture (cropland in Eastern China) and land that is mostly non-agriculture (forests, grasslands). This is based on the average over 10 years of data from MODIS. The region considered is roughly Mongolia and China. Other parts of the world look much different – more analysis like this in the link to my paper below.

The figure above shows that while the land with a low fraction of cropland (less than 20%) tends to burn in July-August, the land with a high fraction of cropland (greater than 80%) tends to burn in (you guessed it) June-July. As the caption states, these “average” seasonalities are based on over 10 years of Terra MODIS fire observations. When you average 10+ years of Junes for the low and high fraction of cropland, you get the data point in month six for blue and green curves above. In other words, the fires are right on schedule, Eastern China! Hopefully for the citizens of Beijing, the burning will be short-lived and meteorology will transport the smoke away and dilute it down with clean air in the process.

All that being said, a full scientific analysis of the air quality requires much more than this post offers. Sensitivity, ground-based analysis, meteorological analysis, and actual counting of the fires among other things would be required to prove with a much higher degree of confidence that my hypothesis does not fail, but usually scientists make hypotheses because they observe an event/phenomenon that is consistent or inconsistent within some sort of framework. In this case, what I saw in China air quality was inconsistent with what I understood about the meteorology there (for this time of year) and consistent with the work I did with colleagues regarding fire seasonality.

*The unit of concentration for PM2.5 is micrograms per cubic meter which is often written as ug/m3 even though the “u” should be the Greek letter “mu” which itself means “micro” which is one millionth and “m3” should be “m” with a superscript “3” to indicate “cubed”)

May 2013 climate in North Carolina and the world

With global warming and all of the impacts, it’s very important to constantly consider the question of time and space scales. May 2013 is a good example for those of us living in the Southeastern USA or North Carolina. Namely, North Carolina’s normal-to-cool spring is not at all indicative of how the global temperature is evolving. Let’s see how we can quickly use NOAA NCDC graphs to figure this out.

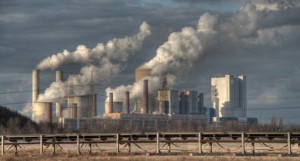
Global warming refers to the increase in average temperature of the entire Earth. The last part – the entire Earth – is the spatial scale. And that’s a huge spatial scale! When a scientist talks about global warming or that global warming has been detected, you have to step back and say WOW. What on Earth could warm an entire planet? coal_fired_power_plantOver long time scales, of course there are a number of possible reasons (changes in the Sun, Earth’s orbital shape/proximity around the Sun, plate techtonics), but these take so long, they aren’t relevant to the concept of global warming. Even my statement that What on Earth could warm an entire planet? should be more precise and say something like What on Earth could warm an entire planet over a relatively short time period? The simplest, if somewhat incomplete, answer is the combination of greenhouse gases and aerosols emitted into the atmosphere from human activities. Period.
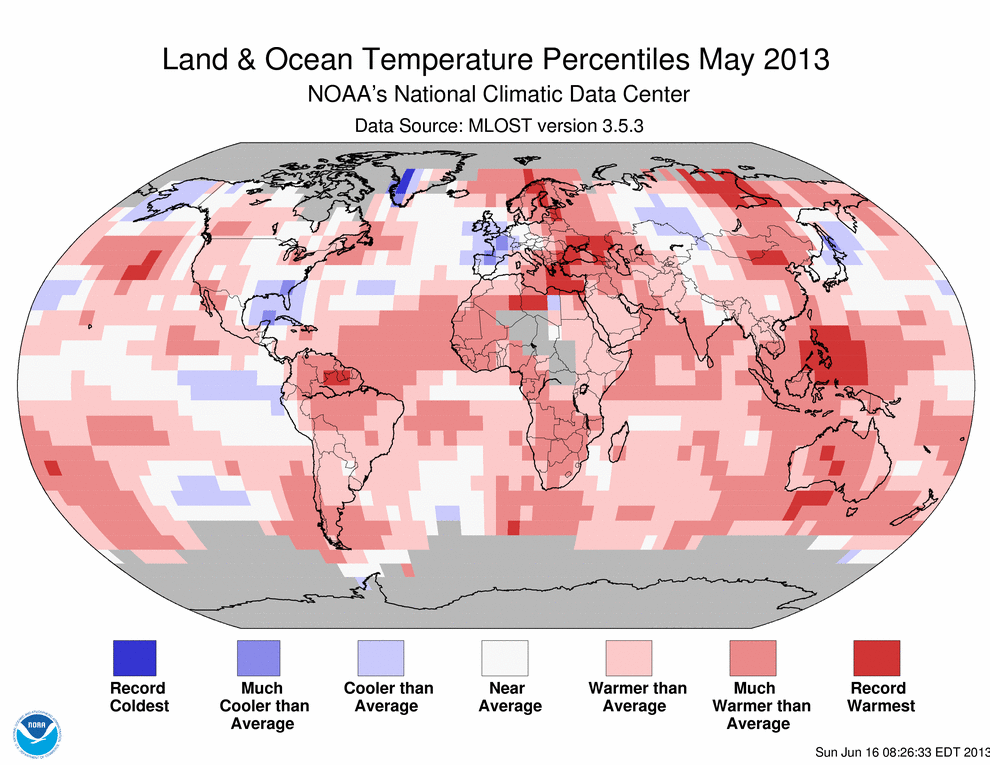
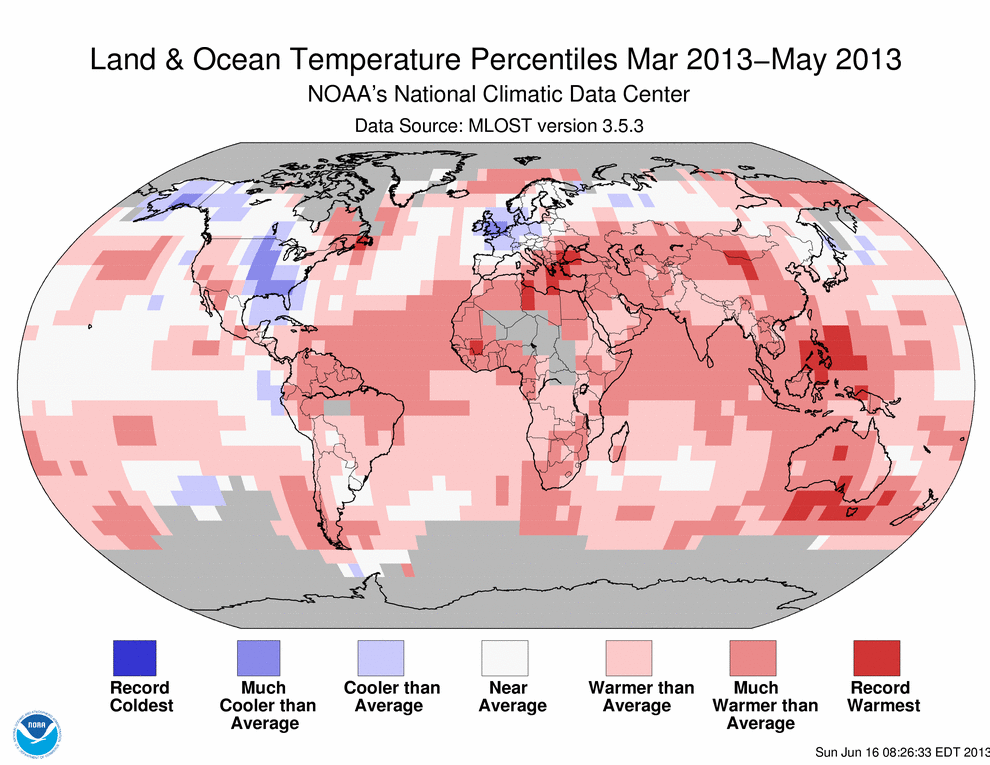
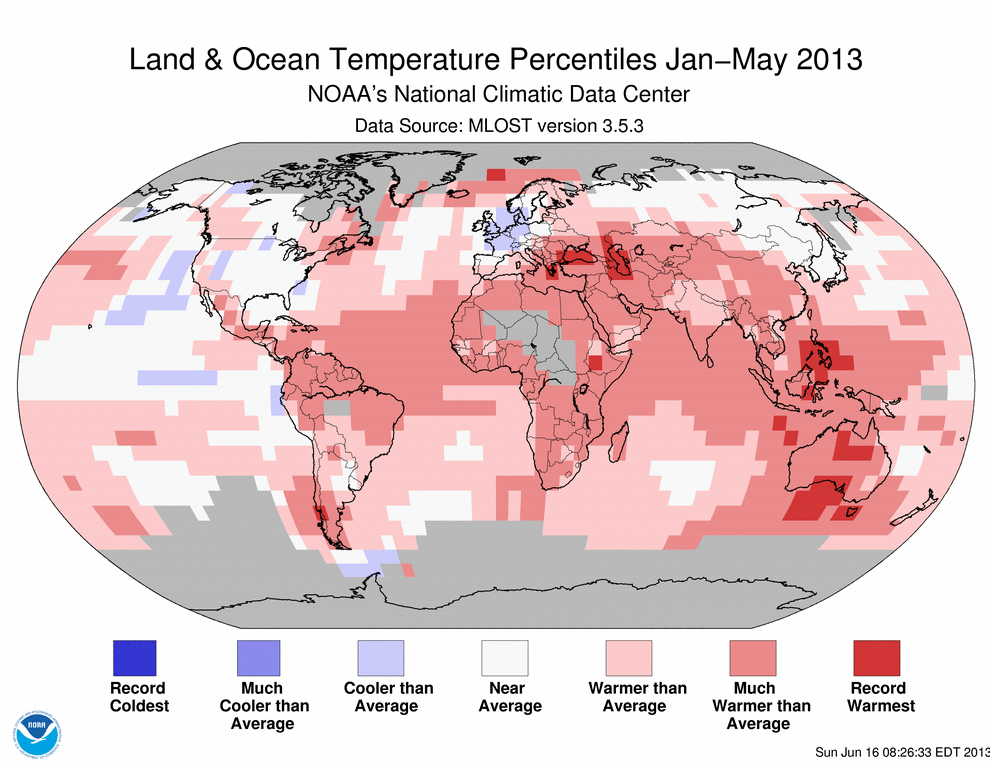
May 2013 analysis of global temperatures are trickling out. NOAA NCDC as always has a wonderfully complete report of climate news for May and for all previous months. My favorite part is the plethora of hyperlinks. NOAA NCDC should really be commended for their public outreach! Here is one of the figures from that webpage201305where you can see how different the Southeast USA is from the world in May 2013 – the world is shades of red, while the Southeast USA is shades of blue (cooler than normal). We’ve had a very pleasant spring in North Carolina. Pull back on the temporal (time) scale to see the March-April-May seasonal average201303-201305 and you can see that the cool spring extends well beyond May in terms of the anomaly. By this, I mean that the blues become deeper when you consider a three month period (March-April-May) and that implies without any quantitative work that March-April were more cooler-than-average. Pull back slightly further to the year-to-date rankings201301-201305and here you see that the Southeastern USA and in fact most of the USA and even Alaska have been right at the climatological normal (which for NCDC is the average temperature from 1981-2010). The short story is that North Carolina below average temperatures for the period from January to May, March to May or just plain old May are not indicative of global temperatures. The real question is why?

North Carolina climate compared to the USA and globe

The first months of 2013 here in Charlotte have seemed unusually cool, but rather than relying on our gut feeling, let’s look at the numbers. Start by going to the NCDC website and mine out the data to find that in Charlotte, January was the 27th warmest in 118 years, February was the 40th coolest, and March was the 4th coldest in 118 years. Now a fair second question is how does Charlotte fit into the big picture? Namely, is Charlotte’s temperature ranking similar to that of the whole state of North Carolina, the USA, and even the world? With only a little bit of work, we can figure this out. The data below shows temperature anomaly compared to the 20th Century average as a +/- number, and the parenthetical numbers are the ranking in the overall temperature record (1 is hottest). USA has 119-120 years of data, while the global time series begins in 1880.

                  Charlotte*    North Carolina   USA**        Global Land   Global***
    April 2012    +1.7 (31)     +1.1 (39)        +3.7 (3)     +1.1 (6)      +0.6 (7) 
      May 2012    +2.9 (13)     +2.9 (11)        +3.3 (2)     ? (7)         +0.5 (10) 
     June 2012    -1.5 (93)     -1.5 (98)        +2.0 (12)    +0.9 (4)      +0.6 (7) 
     July 2012    +2.4 (8)      +3.2 (2)         +3.3 (1)     +0.8 (5)      +0.6 (7) 
   August 2012    -1.3 (97)     -0.4 (69)        +1.7 (13)    +0.8 (2)      +0.6 (8) 
September 2012    -1.6 (83)     -0.9 (72)        +1.4 (23)    +0.9 (4)      +0.5 (8) 
  October 2012    -1.5 (81)     -0.6 (65)        -0.3 (73)    +1.1 (2)      +0.6 (8) 
 November 2012    -3.6 (109)    -3.6 (108)       +2.0 (20)    +1.1 (6)      +0.7 (5) 
 December 2012    +5.1 (8)      +5.5 (8)         +3.3 (10)    +0.2 (49)     +0.4 (18)
  January 2013    +2.8 (27)     +3.5 (24)        +1.5 (42)    +0.9 (13)     +0.5 (9)
 February 2013    -2.0 (80)     -0.8 (70)        +0.9 (49)    +1.0 (11)     +0.6 (9)
    March 2013    -6.7 (116)    -5.9 (114)       -0.8 (77)    +1.1 (11)     +1.0 (10)

What’s remarkable is that at first glance, it seems like the rankings of Charlotte and NC are essentially on the opposite end of the spectrum of rankings compared to the global rankings in the last 12 months. There’s an easy way to quantitatively evaluate the relationship between sets of numbers and that is by using the statistical correlation coefficient, usually represented by the variable r. A positive r value means the numbers go up and down together, while a negative r means one set of numbers go up while the other goes down. When r is +1 or -1, that means the two sets of numbers are perfectly correlated and perfectly anti-correlated, respectively. Perfect correlation or anti-correlation never happens with data, unless you calculate the correlation of a dataset against itself which isn’t very interesting. That being said, r near +1 or -1 usually indicates that the two datasets being compared are statistically related. To quantify “usually” from the previous sentence and to contextualize the r value, a corresponding statistic that accompanies r is the p value. The p value is a way to quantify the statistical significance of the r value and depends. A p value less than 0.05 means there’s a 95% chance that a random set of numbers is not better related than the numbers you are testing. Thus when p is less than 0.05, you can be confident there is “statistically significant” relationship – remembering that correlation does not imply causation. This kind of analysis is done all the time in all fields of science, which speaks to the idea that math is the universal language. In the table below, r is the +/- number, p is the parenthetical number.

                NC              USA           Global Land    Global
    Charlotte   +0.97 (<0.05)   +0.52 (0.08)  -0.43 (0.16)   -0.43  (0.16)
           NC   -               +0.48 (0.11)  -0.39 (0.21)   -0.44  (0.16)
          USA   -               -             -0.10 (0.77)   +0.002 (0.99)
  Global Land   -               -             -              +0.92  (<0.05)

Now we’re getting somewhere. Over the last 12 months, Charlotte and NC temperatures are, as expected, significantly correlated (r = +0.97, p < 0.05). If Charlotte sets a cold or warm record, so does NC. Global land and ocean ("global" in the table) and global land are significantly correlated (+0.92, p < 0.05) as well. Not that shocking. What I didn't expect until I started comparing the trend in the rankings is that NC and Charlotte rankings are not significantly related to the USA or global temperature rankings. This is evident by the high p values in parenthesis in the 1st and 2nd rows. Surprisingly, NC and Charlotte are nearly significantly anti-correlated (negative r values, see above) with global rankings, something that might be worth looking into with more data. What’s perhaps even more surprising to me is that USA temperature rankings are essentially unrelated to the either of the global temperature rankings. This means that any given month in the USA tells you absolutely nothing about the global ranking for the same month – you might as well just guess. More data will tell the a more complete story here (and provide better stats), but over the last 12 months, there are some interesting possible relationships (Charlotte and NC similar to the USA, but opposite of the globe), and then occasions where the two datasets have no idea the other exists (USA and the globe). No wonder people get mixed up when looking at the news about global warming and then try to relate it to what’s going on in their backyard.

* NC Climate Division 5
** Contiguous USA
*** Combined land and ocean since 1880, as opposed to “global land” which is only land surfaces. Note May 2012 T anomaly wasn’t listed on NCDC site, but the ranking was. My stats analysis was based on the ranking, so the “missing” data point is not relevant.

Resources for learning about the state of the climate

An atmospheric scientist likes to talk about the “state” of the atmosphere. A “meteorological state” usually means knowing the temperature, pressure, dewpoint temperature (moisture), and maybe the wind speed and whether there is precipitation. Climate state is similar but usually presented as a comparitive. I’ve talked about this before, but the essential calculation to understand in climate is the idea of a “departure” or an “anomaly”.*

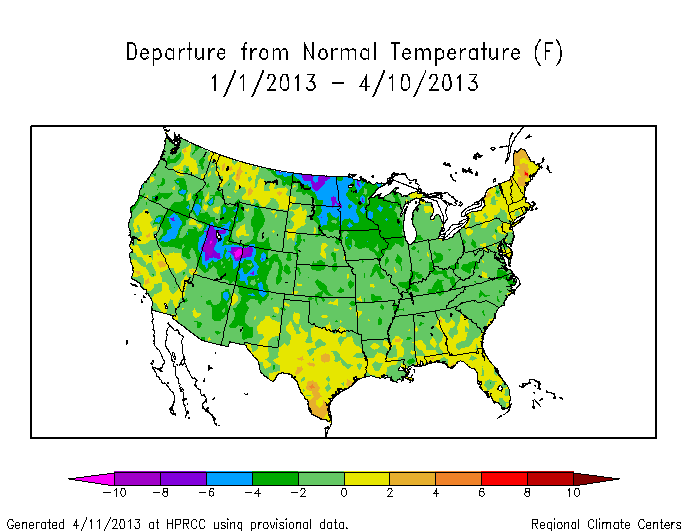
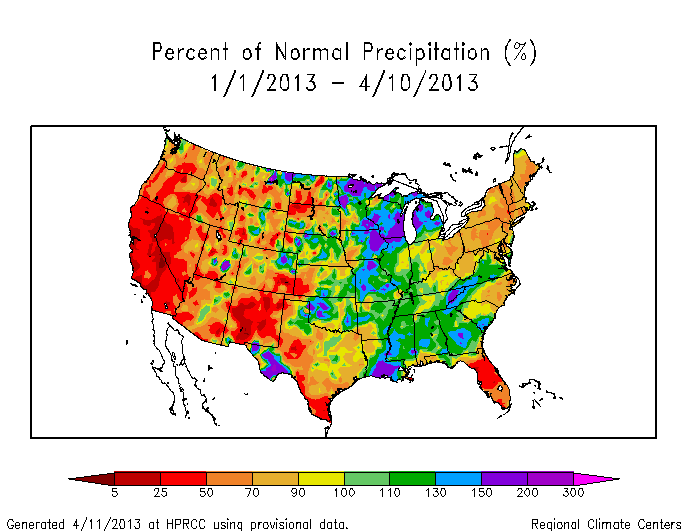
Climate departures from, say, a climate normal examine the change with respect to what we might expect given past knowledge. A great online resource with very up-to-date climate state is the daily-updated graphs of monthly temperature departure at the High Plains Regional Climate Center (HPRCC). You can easily create presentation-ready figures (properly citing HPRCC) such as temperature departure since first of the month, percent of normal precipitation since first of month, and the analogous figures for temperature departure and percent of normal precip since the first of the year. Here are examples of T and precip in 2013 (so far).

YearTDeptUS-2013-04

YearPNormUS-2013-04

By pressing a few buttons on the internet, you have access to a powerful and constantly evolving data set for the USA. You can evaluate where the USA is in terms of “Is the USA headed to another record warm year like 2012?”, “Has the drought subsided to any degree in the new calendar year?”. With some digging, you can get the numbers in the figures and embark on a more detailed analysis of trends and spatial patterns, but first-order analysis via the HPRCC figures is the natural place to start. For example, studying the figures above, we can quickly deduce that the temperatures in 2013 have been unremarkable compared to the climate normal period (1981-2010). In fact, I think we can safely conclude that through 10 April 2013, the temperature has been cooler than the climate normal period, or in terms of the colors on the graph, most of the figure is light green (a slight negative departure). This is a big shift from 2012, where March shattered records across much of the country and started off a long anomalously warm year in the USA. Precipitation trends for 2013 (so far) seem to suggest that the mountain west remains at less than 50% (red to dark red) of the climate normal period precipitation. The spatial map figures give you the additional power to watch not only the country, but parts of the country that might be more directly relevant to you.

Global warming introduces the increased probability of more warm years – this is very clear from data which I’ll post about soon. In the meantime, when you ask a question about the climate state, you can rest assured that they can be answered. What will 2013 bring us when the fire season starts in earnest? Or as the temperature time series evolves? Keep clicking on HPRCC to find out. Unlike sports seasons, the season for climate-relevant stats never ends.

*This is true in weather studies as well, but the motivation is different. Weather departures look at the magnitude of a departure to help evaluate the strength of the weather especially with regards to the pressure and temperature. Think of a hurricane. Most discussions of a hurricane talk about the central pressure – the air pressure in the eye of the storm. A low number usually indicates a more dramatic (negative) departure from “normal” pressure at sea level. This leads to a higher force moving the air from outside the hurricane towards the eye – air moves from high to low pressure. If you’re wondering, the spinning of a hurricane happens because the moving air is also affected by the coriolis effect from the rotating Earth.