data visualization

Climate science movies

I held a screening of Thin Ice: The Inside Story Of Climate Science on Earth Day in April 2013, the day the film was released. The response from the students was good – they liked seeing Earth scientists working on complex data collection related to improving our collective understanding of the Earth system. thiniceBased on a written survey I asked many to fill out, I would say that the most general concern was that Thin Ice did not show enough data analysis – a great initial exploration into climate data is the National Academy of Sciences documentary on youtube called Climate Change: Lines of Evidence. I personally really appreciated the work of the Thin Ice film makers in showing not only how cohesive seemingly disparate problems in Earth sciences actually are, but also how enthusiastic Earth scientists are about their work. This enthusiasm, this love of their world and trying to understand it, is in my experience “the norm” amongst scientists studying some aspect of the Earth, whether that research is about the climate or climate change or weather or whatever (Earth sciences is a big topic). We love actively trying to solve these mysteries and understand how the physical world works. So I heartily recommend Thin Ice to anyone thinking about majoring in Earth Sciences or Meteorology or Geology or Geography. chasingiceYou may not work with ice cores or ocean-based research or even climate models, but you will have the chance to work with a group of highly dedicated people on problems that are interesting and sometimes poorly understood. Let your passion lead you!

Thin Ice the movie is available for mp4 download for only $10 through June 15 and you can watch from any device that plays mp4s. I will almost certainly screen Thin Ice in the Fall and Spring semesters of the upcoming academic year in my courses (Global Environmental Change and Applied Climatology). I am planning on buying another movie that visualizes change in a much different way called Chasing Ice. I haven’t watched this one yet, but I’ve heard very good things about the sweeping and powerful images of ice melting away before our eyes as the globe continues to warm.

Why is ice the theme of both movies? Well, actually Thin Ice is more about the scientists studying climate and my understanding of Chasing Ice is that it documents the ice as it is now with the implication that the ice will not be this way in even another generation. So, two ice-themed movies, but much different messages. Buy the mp4 of Thin Ice or watch for my screenings announcements. I’m 90% sure I’ll screen Chasing Ice in at least one of my classes as well. Visualizing global warming and seeing what scientists do (and LIKE to do!) is really important.

CO2 and climate sensitivity

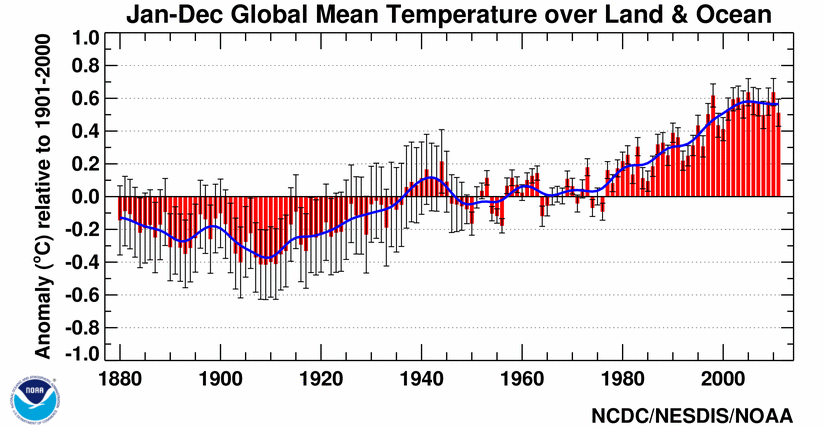
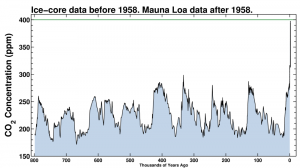
On Thursday, May 16, 2013, the official daily-averaged CO2 concentration in the atmosphere was reported by Scripps as (drumroll please)co2-2013-05-16Like I pointed out, 400 ppm is inevitable because CO2 increases by 2 ppm every year, but to actually see a value like that reported makes it more real. Now we await a value that is over 400 ppm for an entire week, and then for a month, and then it’s just a matter of time when we are in a world with 400 ppm of CO2, remembering how different this is than any time in Earth’s recent history as shown in the figure to the right (click to make larger).co2_800kRemember that CO2 in the atmosphere is a pretty simple physical perturbation on the Earth’s energy budget – more CO2 will result in an atmosphere that absorbs more of the infrared energy that the Earth emits to space to try and cool off. The energy that does not escape and is absorbed is then re-emitted towards the surface (and towards space). This forces the Earth to warm in response to try to bring the energy budget back into balance since balance is inevitably what everything in the universe seeks to achieve. This forcing of the Earth’s temperature has never been in doubt. The real question is how the Earth SYSTEM will respond to the extra energy or extra warmth. The SYSTEM is something I will start talking about here and it is certainly the most complicated aspect of climate science. Imagine the complexities associated with trying to understand how the atmosphere, ocean, land and plants, ice, and even humans and animals will all respond and how each affects the other! That is the heart of Earth system science and the heart of the very current discussion about climate sensitivity – a measure of how the system in total will respond to perturbations like more CO2 in the atmosphere. A very nice op-ed in the New York Times by Justin Gillis this week highlights the frank evaluation and debate about climate sensitivity occurring in the scientific community that has arisen from the apparent slowdown in the increase in globally averaged temperature (since about 2002 in the GISS time series or slightly more evident in the NCDC time series below)global-201101-201112The issue is getting a load of attention and, as Gillis wisely acknowledges, the analysis and studies in the peer-reviewed scientific literature will take a couple of years to “settle” on an answer. I agree. The public and policy makers and just about everyone wants to know the answer though so every publication or even statement about climate sensitivity will be intensely amplified. I’ve been reading about this issue myself, mostly as I prepare to bring the very current discussion into the classroom (here, here), but also because I am as concerned about the Earth as anyone. Here’s a final statement by Gillis that I also agree with.
Even if climate sensitivity turns out to be on the low end of the range, total emissions may wind up being so excessive as to drive the earth toward dangerous temperature increases. So if the recent science stands up to critical examination, it could indeed turn into a ray of hope — but only if it is then followed by a broad new push to get the combustion of fossil fuels under control.

Regardless of the climate sensitivity, changes to our lifestyles are inevitable. Will our society and will the USA be seen as forward-thinking or will we revert to the simplest and most destructive way to get energy?

Resources for learning about the state of the climate

An atmospheric scientist likes to talk about the “state” of the atmosphere. A “meteorological state” usually means knowing the temperature, pressure, dewpoint temperature (moisture), and maybe the wind speed and whether there is precipitation. Climate state is similar but usually presented as a comparitive. I’ve talked about this before, but the essential calculation to understand in climate is the idea of a “departure” or an “anomaly”.*

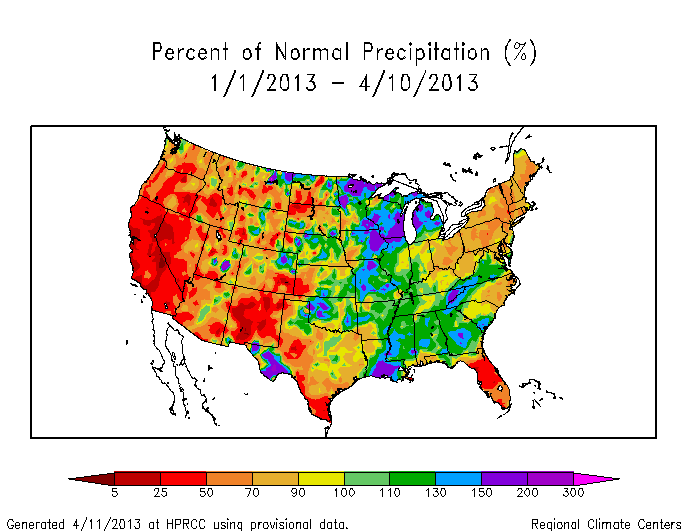
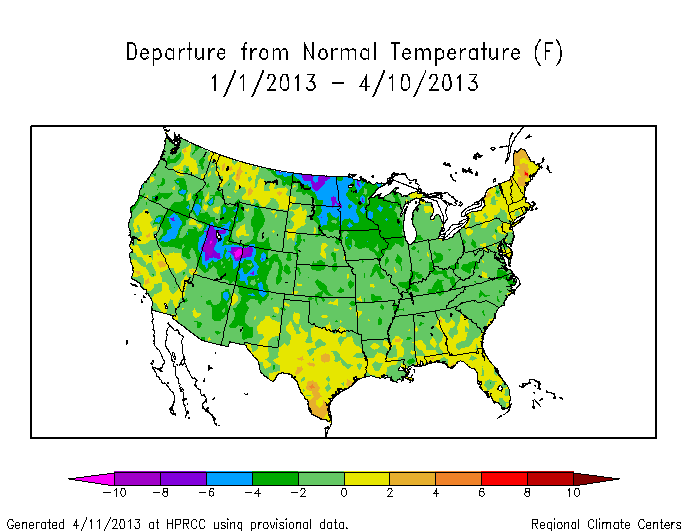
Climate departures from, say, a climate normal examine the change with respect to what we might expect given past knowledge. A great online resource with very up-to-date climate state is the daily-updated graphs of monthly temperature departure at the High Plains Regional Climate Center (HPRCC). You can easily create presentation-ready figures (properly citing HPRCC) such as temperature departure since first of the month, percent of normal precipitation since first of month, and the analogous figures for temperature departure and percent of normal precip since the first of the year. Here are examples of T and precip in 2013 (so far).

YearTDeptUS-2013-04

YearPNormUS-2013-04

By pressing a few buttons on the internet, you have access to a powerful and constantly evolving data set for the USA. You can evaluate where the USA is in terms of “Is the USA headed to another record warm year like 2012?”, “Has the drought subsided to any degree in the new calendar year?”. With some digging, you can get the numbers in the figures and embark on a more detailed analysis of trends and spatial patterns, but first-order analysis via the HPRCC figures is the natural place to start. For example, studying the figures above, we can quickly deduce that the temperatures in 2013 have been unremarkable compared to the climate normal period (1981-2010). In fact, I think we can safely conclude that through 10 April 2013, the temperature has been cooler than the climate normal period, or in terms of the colors on the graph, most of the figure is light green (a slight negative departure). This is a big shift from 2012, where March shattered records across much of the country and started off a long anomalously warm year in the USA. Precipitation trends for 2013 (so far) seem to suggest that the mountain west remains at less than 50% (red to dark red) of the climate normal period precipitation. The spatial map figures give you the additional power to watch not only the country, but parts of the country that might be more directly relevant to you.

Global warming introduces the increased probability of more warm years – this is very clear from data which I’ll post about soon. In the meantime, when you ask a question about the climate state, you can rest assured that they can be answered. What will 2013 bring us when the fire season starts in earnest? Or as the temperature time series evolves? Keep clicking on HPRCC to find out. Unlike sports seasons, the season for climate-relevant stats never ends.

*This is true in weather studies as well, but the motivation is different. Weather departures look at the magnitude of a departure to help evaluate the strength of the weather especially with regards to the pressure and temperature. Think of a hurricane. Most discussions of a hurricane talk about the central pressure – the air pressure in the eye of the storm. A low number usually indicates a more dramatic (negative) departure from “normal” pressure at sea level. This leads to a higher force moving the air from outside the hurricane towards the eye – air moves from high to low pressure. If you’re wondering, the spinning of a hurricane happens because the moving air is also affected by the coriolis effect from the rotating Earth.

Land use in action

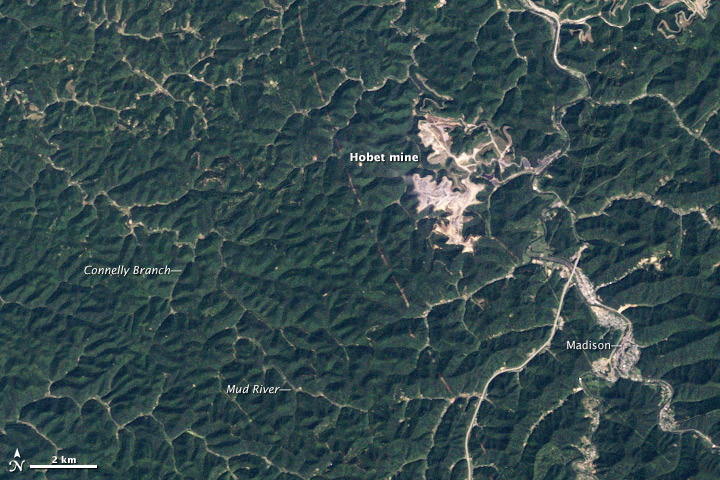
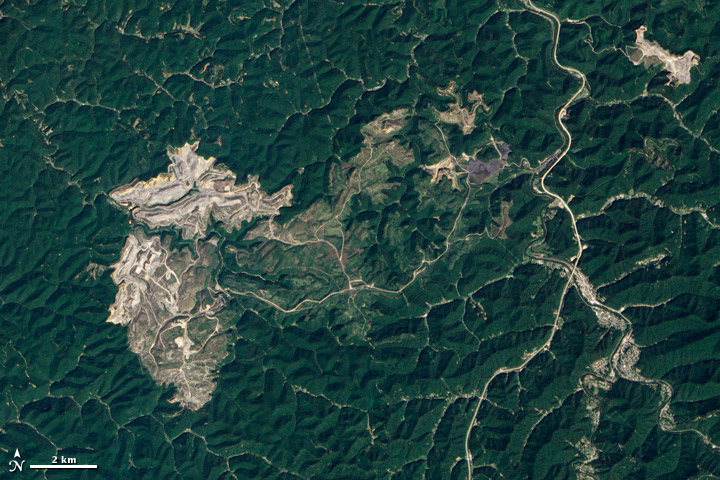
Externalities are the costs that are not incurred by coal mining operations, hydraulic fracturing (fracking), and oil sands extraction. Aside from the fossil fuel emissions from the burning of coal, oil, and natural gas for power generation, the extraction process bears huge costs that most of us are willing to overlook for the short-term economic benefits. If you happen to be in the vicinity of a mine, however, you probably are paying close attention to everything the company in charge is doing. One impact is land-use, and unfortunately for companies tearing into relatively remote regions of the Earth to feed our massive hunger to consume, NASA has some excellent Earth observing satellites. Satellites have been high above Earth since the 1970s and this is one image of a region in West Virginia, USA in 1984 hobet_19840917 with another image of the same region in 2012 hobet_20120920What do scientists do with this kind of imagery? Well, here is a the link to an amazingly clear image-animation of the process of removing a mountaintop in Appalachia (West Virginia, in this case) to uncover the coal. Related to the documentation of the mountaintop removal, is an image-animation of the land-use associated with the tar sands/oil sands extraction from Alberta’s boreal forest. Fracking doesn’t have as long a record, so NASA imagery doesn’t capture the results of this form of land-use. But states in the USA (including North Carolina) are lining up legislation to begin issuing permits for fracking. Proponents cite job creation and reduced greenhouse gas emissions (noting an important caveat to the 2nd point). Critics cite major concerns about just how long those economic gains will keep rolling in before locals are left with an environmental mess to clean up without help from the deep industrial pockets that created the mess.
Resources to understand sea level rise

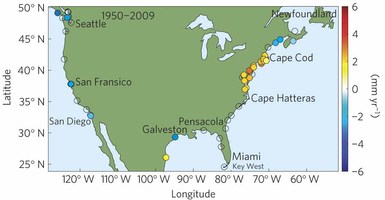
Whereas the global warming app I mentioned is based on analysis of data we already have, the future projections of the impacts of global warmings are ridiculously interesting, speculative, and terrifying at the same time. Hurricane Sandy and some of the stories that emerged from the storm surge – including the story of a building in Brooklyn that happened to be building where a storm surge swept through but was undamaged because the the contractors were building with the knowledge that sea level rise will dramatically affect even NYC (building for the future added $550k to the $100 million budget, says the article) and including a very informative interview with a well-known and respected NASA scientist at NOAA’s relatively new Climate Service website – showed that sea level rise is very much on the mind of many. Yet another great webapp published by the New Scientist shows two examples of SLR and how the non-uniform the impacts are expected to be. This is a projection into the future, but many recent studies, like this one based on tide gauge data, agree with non-uniformity in SLR. A great snippet from that Nature Climate Change publication (which was subject to peer-review before publication) is this one nclimate1597-f2, which shows clearly that the West Coast and East Coast of the USA have already experienced much different responses to SLR. The data seems to be in line with the models, where a model projection is what is shown in the webapp. Another great visualization!
Resources to understand global warming

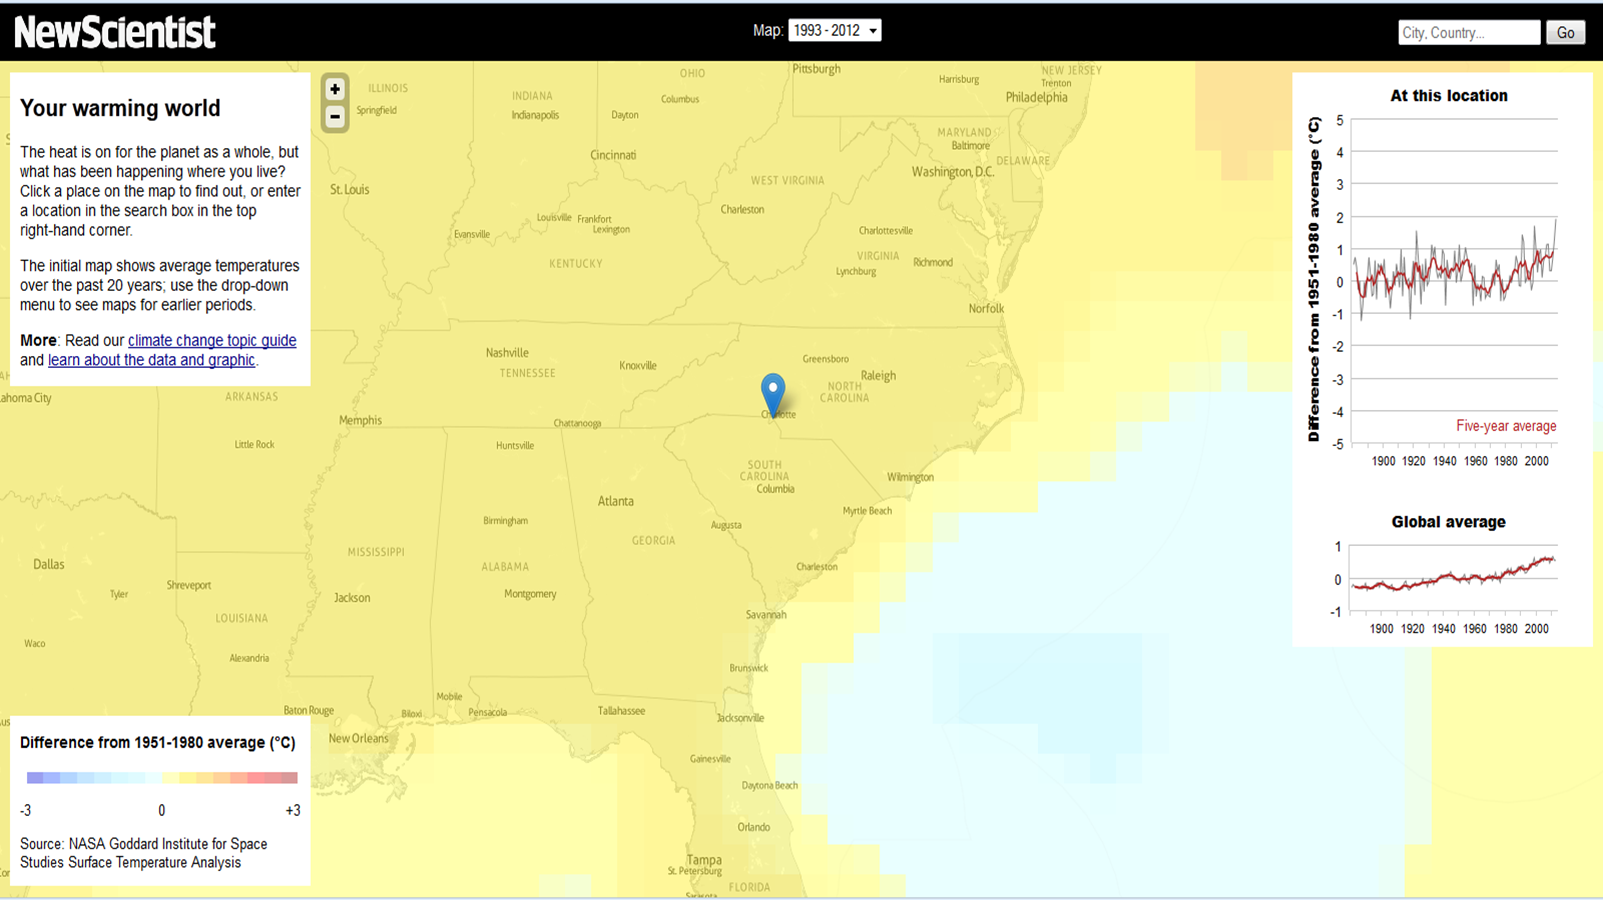
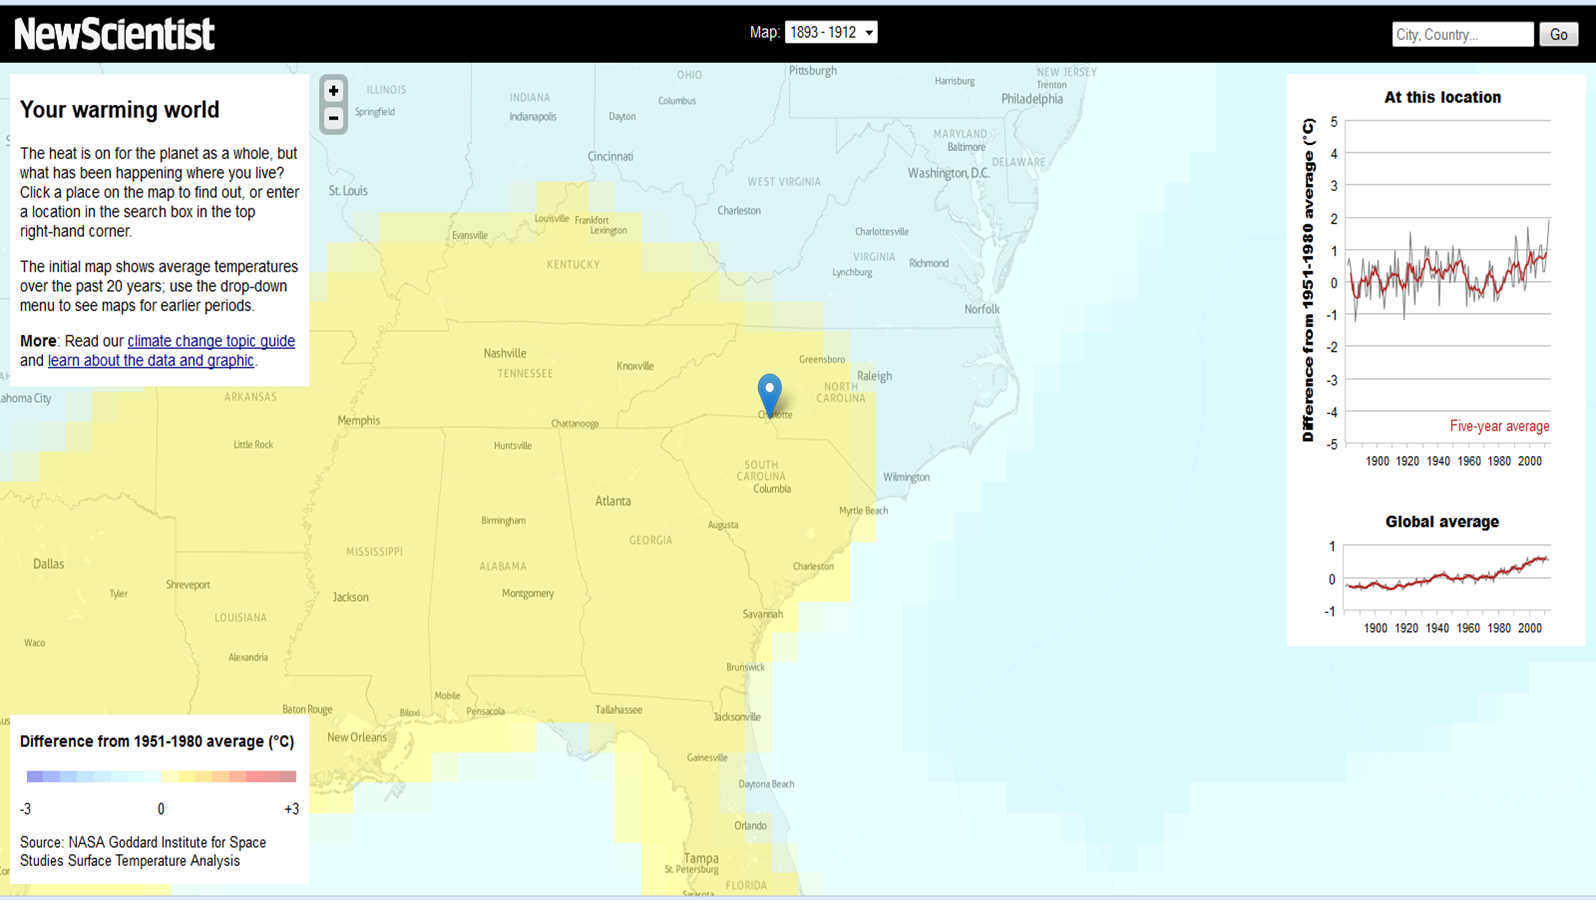
There is a treasure trove of information and misinformation about global warming on the mighty internet. I try to sift through these as I prepare for effective ways to empower students or at least generate discussion. Here are a couple of new-ish resources that visualize the NASA GIStemp gridded temperature anomaly data set, which are described in great detail on that website but also in the peer-reviewed science literature. The New Scientist (UK popular science magazine) created this webapp to allow anyone to point and click on a location to see how the temperature has changed since about 1890. Here’s a snippet of the Southeast USA anomaly averaged from 1893-1912 warming-southeast-1890and then from 1993-2012 warming-southeast-2000The global warming trend is presented on the right side, while the temperature trend for the specific location is right above it. What’s really nice is the pop-up window that the app opens when you hover over that location-specific temperature trend. You can see the data that’s plotted! Admittedly, it’s pretty easy to get from NASA GISS as indicated via the links on the webapp itself, but still, it’s a great effort by the New Scientist to make sure any person who wants to can reproduce the analysis. And, most importantly, the app itself is a really accessible way to “see” global warming. Other temperature data sets (HadCRU, NOAA NCDC, and a couple of others) have trends that are very similar to NASA GISS – if I find a link showing this comparison, I will post it.