Another major conference is on the horizon – the Association of American Geographers (AAG) meeting which is in Chicago this year. Check #AAG15. Conferences are absolutely critical for multidisciplinary/interdisciplinary research, and I think for just about all research. Science, like many (most?) other professional enterprises, requires discussion. My first AAG was last year in Tampa, and that was a great experience. The atmosphere at the Tampa conference was informal, yet had the intensity associated with presenting a range of results from preliminary to pretty polished to peer-reviewed and published results. I also liked the thematic message from AAG 2014: Research about climate change past, present, and future will benefit from geographical thinking.

Annual firecounts from the NASA MODIS sensor on the Terra satellite. Nearly 2 million fires happen every year!
AAG 2015 will include a full day talks about fire on our planet, or pyrogeography. I think pyrogeography is a great term that encapsulates my research. So Earth Day 2015 for me will be at the AAG Pyrogeography Session. I worked with several different types of researchers studying pyrogeography to bring data, modeling, and cultural expertise together for what is now 25 talks on Wednesday April 22. 8am to 7pm.
Pyrogeography Sessions at AAG
8:00 AM – 9:40 AM 2101 Pyrogeography I: Fire Histories 1
10:00 AM – 11:40 AM 2201 Pyrogeography II: Fire Histories 2
11:40 AM – 1:20 PM Lunch
1:20 PM – 3:00 PM 2401 Pyrogeography III: Fire Drivers
3:20 PM – 5:00 PM 2501 Pyrogeography IV: Fire Case Studies
5:20 PM – 7:00 PM 2601 Pyrogeography V: West African Fires
My talk will focus on how global fire modeling – a framework to simulate the biogeophysical processes driving fire activity – contributes to the discussion, and how it can advance the discussion so that we can better test hypotheses about human-climate-fire interactions. I’ve been closely reviewing some recent (peer-reviewed, published) work by scientists working on fire modeling to prepare for my talk. One of my current favorite visualizations of how human activities introduce big challenges in fire modeling is from a paper by Pfeiffer, Spessa, and Kaplan that shows that the biggest discrepancies between complex fire modeling and satellite data (like above) are in parts of the world most impacted by humans.
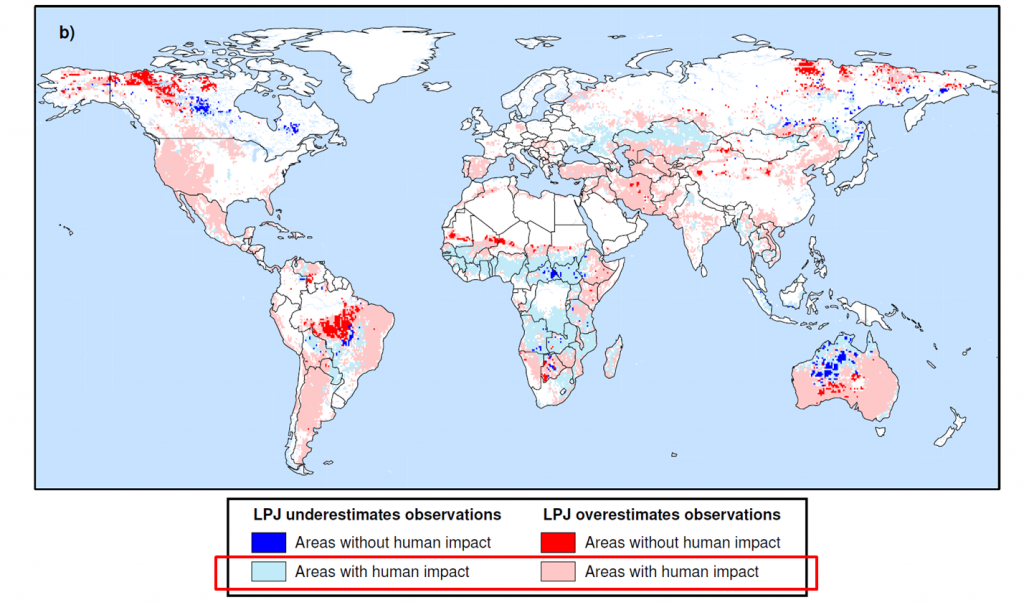
Lighter colors indicate that regions with larger discrepancies from observations are in areas impacted most by humans.
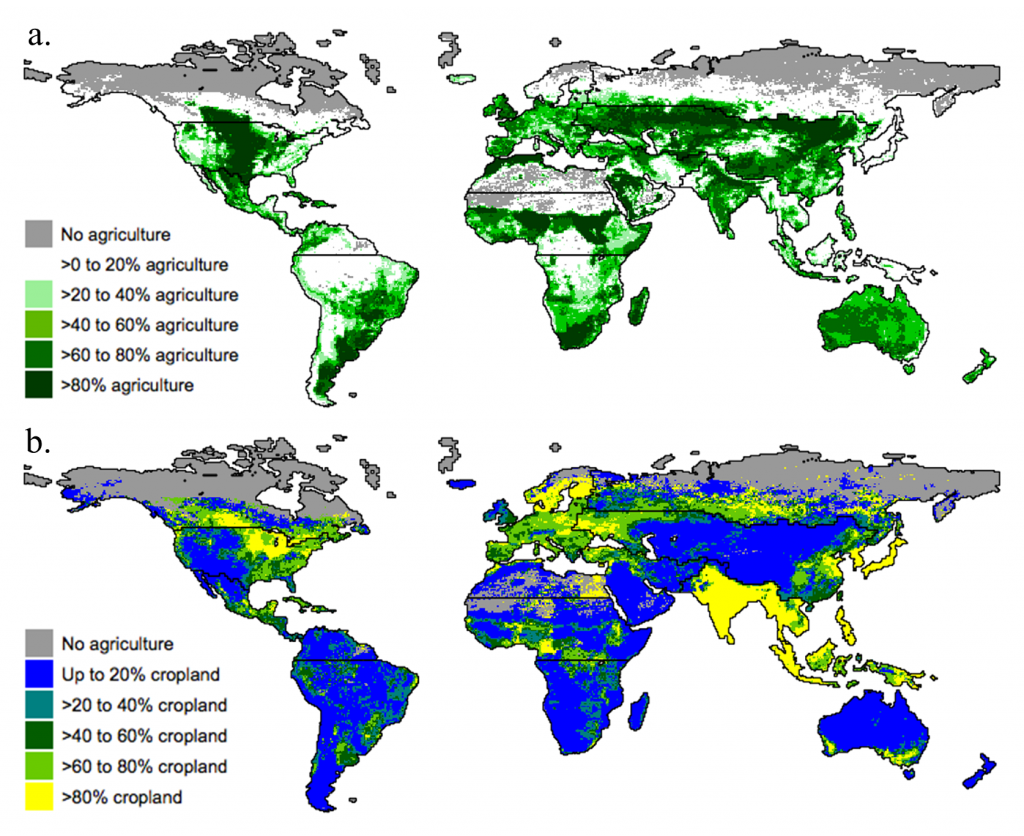
Distribution of agriculture, cropland, and pasture.

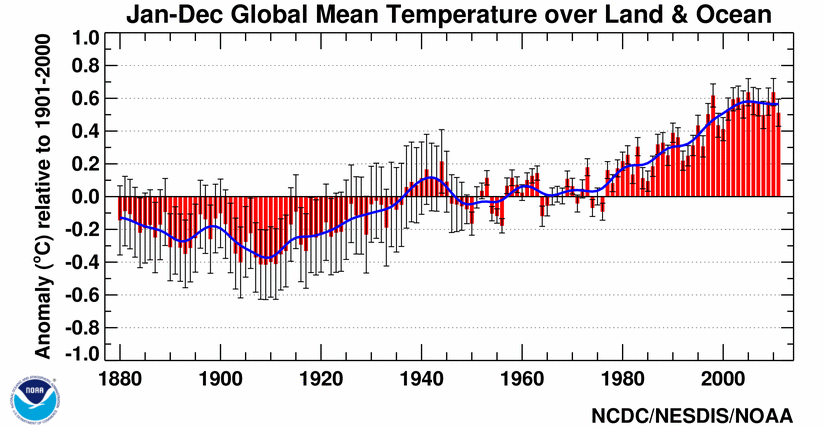 As real as global warming (figure above from
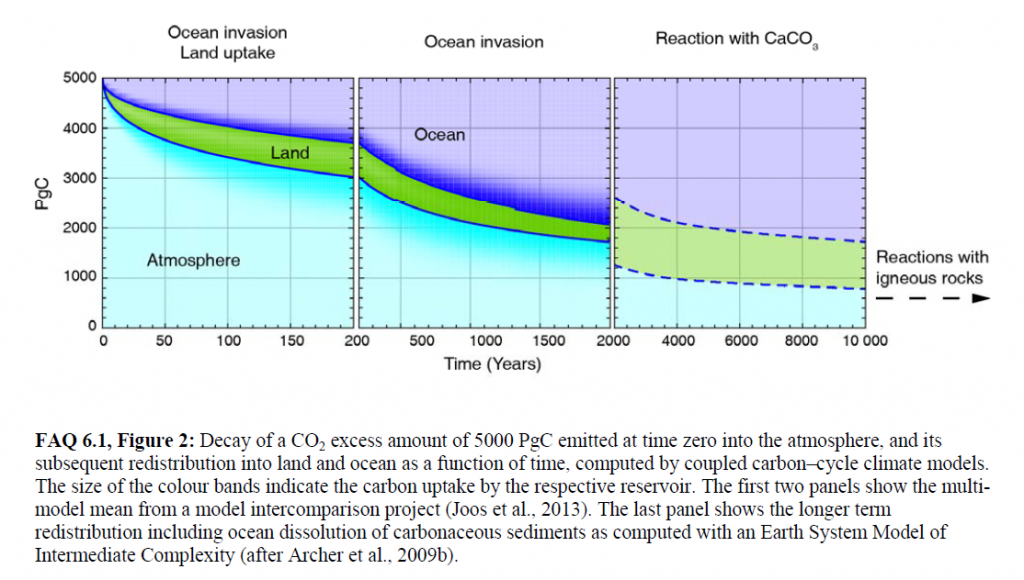
 Go to their
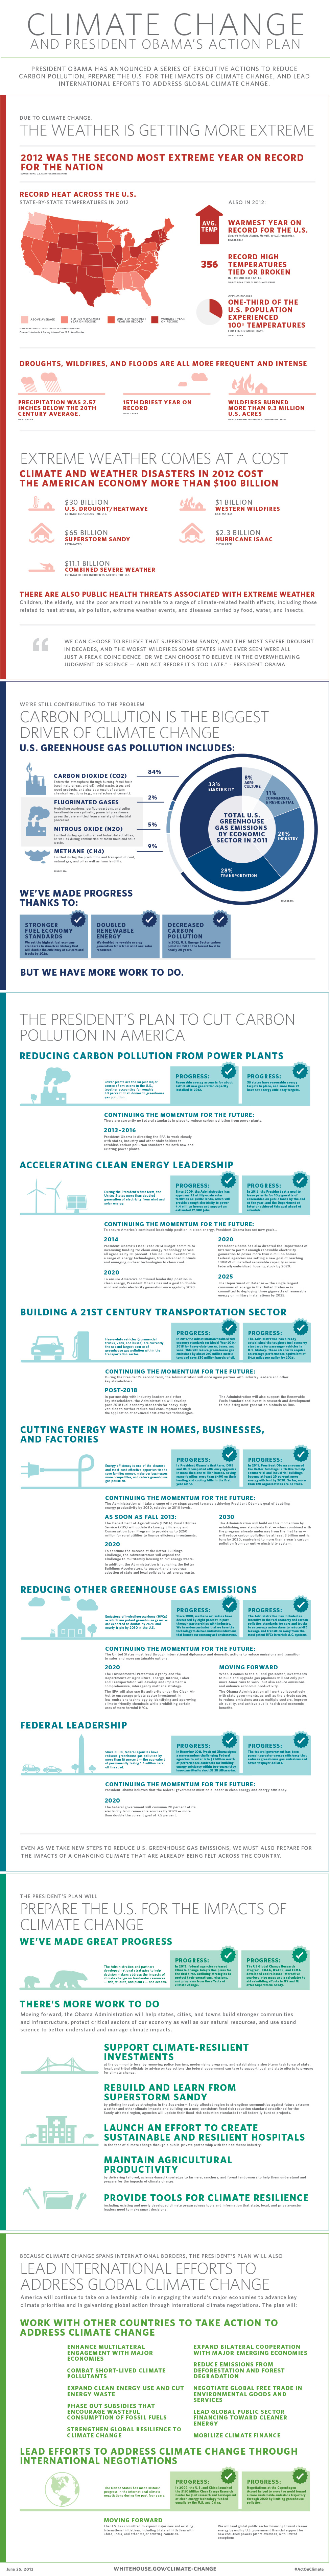
 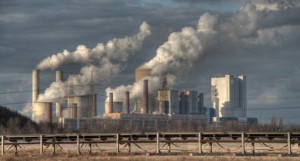 Over long time scales, of course there are a number of possible reasons (changes in the Sun, Earth’s orbital shape/proximity around the Sun, plate techtonics), but these take so long, they aren’t relevant to the concept of global warming. Even my statement that What on Earth could warm an entire planet? should be more precise and say something like What on Earth could warm an entire planet over a relatively short time period? The simplest, if somewhat incomplete, answer is the combination of greenhouse gases and aerosols emitted into the atmosphere from human activities. Period.
 I haven’t read the IEA report, but I came across the
 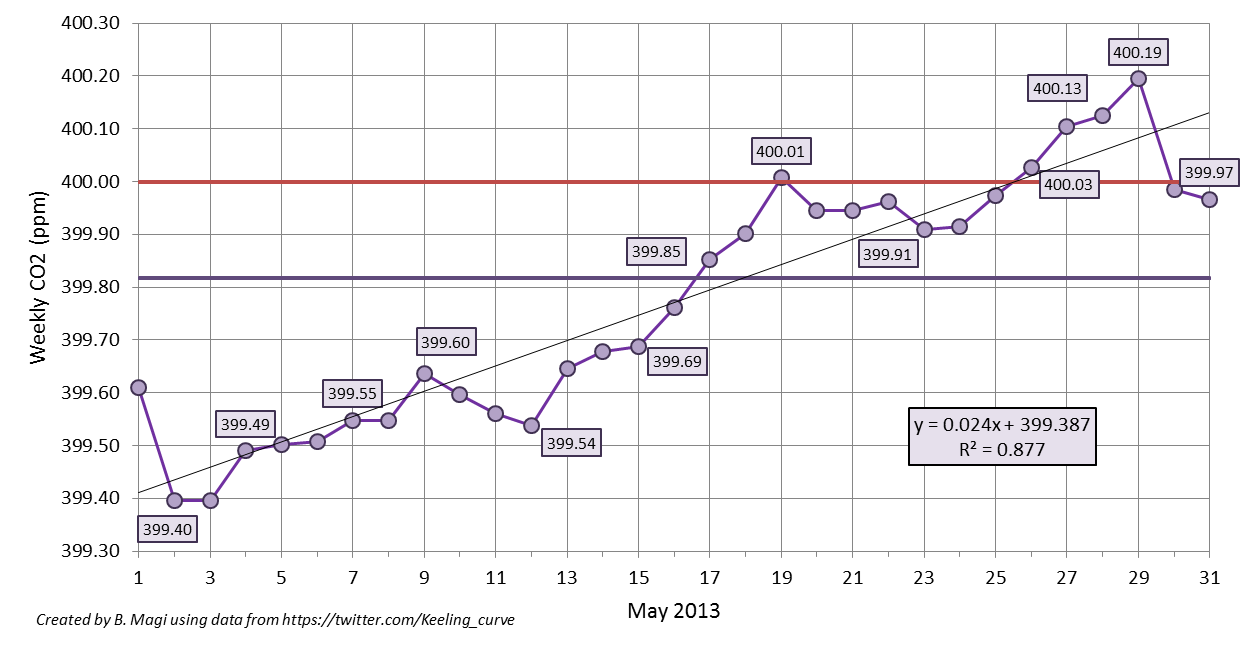 which shows the weekly-averaged CO2 from the daily-averaged values posted on Twitter (ok, tweeted). The straight horizontal purple line is the monthly-averaged CO2 of 399.82 ppm (wow!), and the straight red line is the mystical 400 ppm CO2. I calculated the weekly-average as the value of the previous 7 days up. For example, May 15 weekly-average is the average of values from May 9 through May 15. The weekly-average ideally is 7 data points, but