• My UNC Charlotte

  • Directory

  • Campus Events

  • Library

  • Prospective Students

    • About UNC Charlotte
    • Campus Life
    • Admissions
    • Graduate Admissions
  • Faculty and Staff

    • Human Resources
    • Auxiliary Services
    • Inside UNC Charlotte
    • Academic Affairs
  • Current Students

    • Athletics
    • Financial Aid
    • Advising
    • Student Health Center
  • Alumni and Friends

    • Alumni Association
    • Advancement
    • Foundation
    • Make a Gift
Dr. Brian I. Magi
Dr. Brian I. Magi
Associate Professor of Atmospheric Sciences
  • My UNC Charlotte

  • Directory

  • Campus Events

  • Library

  • Prospective Students

    • About UNC Charlotte
    • Campus Life
    • Admissions
    • Graduate Admissions
  • Faculty and Staff

    • Human Resources
    • Auxiliary Services
    • Inside UNC Charlotte
    • Academic Affairs
  • Current Students

    • Athletics
    • Financial Aid
    • Advising
    • Student Health Center
  • Alumni and Friends

    • Alumni Association
    • Advancement
    • Foundation
    • Make a Gift
  • Welcome!
  • Teaching
    • Air Quality (ESCI 3220)
    • Physical Meteorology (METR 3220)
    • Statistics and Data Analysis in Earth Sciences (ESCI 4122/5122)
    • Global Environmental Change (ESCI 3101)
    • Atmospheric Chemistry (ESCI 4220 / ESCI 5220)
    • Climate Dynamics (METR 4205 / ESCI 5205)
    • Atmospheric Thermodynamics (METR 3210)
    • Applied Climatology (METR 4150 / ESCI 5150)
  • Research
    • Air Quality
    • El Nino
    • Climatology
      • Southeast Climatology
      • USA climatology
      • Campus Weather
    • Fire and Lightning
  • Publications
  • Presentations
  • People
  • Prospectives
  • Opportunities

Contact Me

Brian Magi
brian dot magi at charlotte dot edu

Email is the best way to contact me. My office is McEniry 232, and my mailing address is below.

Geography and Earth Sciences
UNC Charlotte
McEniry 331
9201 University City Blvd
Charlotte, NC 28223-0001

Meta

  • Log in
  • Entries feed
  • Comments feed
  • WordPress.org

impacts

President Obama takes the offensive on climate change

June 25, 2013 by Brian Magi
Categories: Group News

Wow. What a speech this afternoon by President Obama on the Georgetown University campus – and a beautiful follow up to his Inaugural Address in January and his State of the Union speech shortly thereafter – noting one satire piece that is worthy of watching. He stepped onto the stage at about 2pm Eastern time and delivered. The backbone was the announcement of the President’s Climate Action Plan (click for PDF). The papers were buzzing – Washington Post for example but there were many many more “responses” to the unveiling of the Climate Action Plan. Twitter was super active from about 2-5 pm Eastern time with #ActOnClimate trending high. I haven’t been around Twitter long enough to see the electricity flowing like this, but watching the speech and the tweets at the same time was pretty inspiring. Entertaining too. Twitter was like a race to see who could point out a quote by @BarackObama the fastest. Obama said a lot of great things, but I like this one.

We don’t have time for a meeting of the Flat Earth society

He pointed out that the Clean Air Act only promoted American innovation and did NOT destroy the economy, and noted that the Clean Air Act passed nearly unanimously with only ONE DISSENTING VOTE. Times have changed! He metaphorically referred to the economic potential of moving to clean energy as the building of a new engine, referring (I presume) to the innovation of the automobile industry in America throughout the 20th century. Clean energy is here in this country now. He said that 75% of wind energy is in Republican districts (!). The community organizer in our President emerged as he gave credit to past Republican efforts to help our environment – the EPA was created under the Nixon administration, for example.

I haven’t found the transcript or the high quality video yet, but June 25, 2013 was a very memorable moment for the USA. I hope it marks the turning point and that the USA leads – like it should, says this US Citizen – the development of a global community around the issue of global warming. I’ll leave you with an amazingly long graphic from the White House page.climate_change_report_62513_final_0

Share this:

  • Click to email a link to a friend (Opens in new window) Email
  • Click to share on X (Opens in new window) X
  • Click to share on Facebook (Opens in new window) Facebook
Tags: climateglobal environmental changeglobal warmingimpactsUSA

Resources to understand sea level rise

February 15, 2013 by Brian Magi
Categories: Earth System Observer

Whereas the global warming app I mentioned is based on analysis of data we already have, the future projections of the impacts of global warmings are ridiculously interesting, speculative, and terrifying at the same time. Hurricane Sandy and some of the stories that emerged from the storm surge – including the story of a building in Brooklyn that happened to be building where a storm surge swept through but was undamaged because the the contractors were building with the knowledge that sea level rise will dramatically affect even NYC (building for the future added $550k to the $100 million budget, says the article) and including a very informative interview with a well-known and respected NASA scientist at NOAA’s relatively new Climate Service website – showed that sea level rise is very much on the mind of many. Yet another great webapp published by the New Scientist shows two examples of SLR and how the non-uniform the impacts are expected to be. This is a projection into the future, but many recent studies, like this one based on tide gauge data, agree with non-uniformity in SLR. A great snippet from that Nature Climate Change publication (which was subject to peer-review before publication) is this one nclimate1597-f2
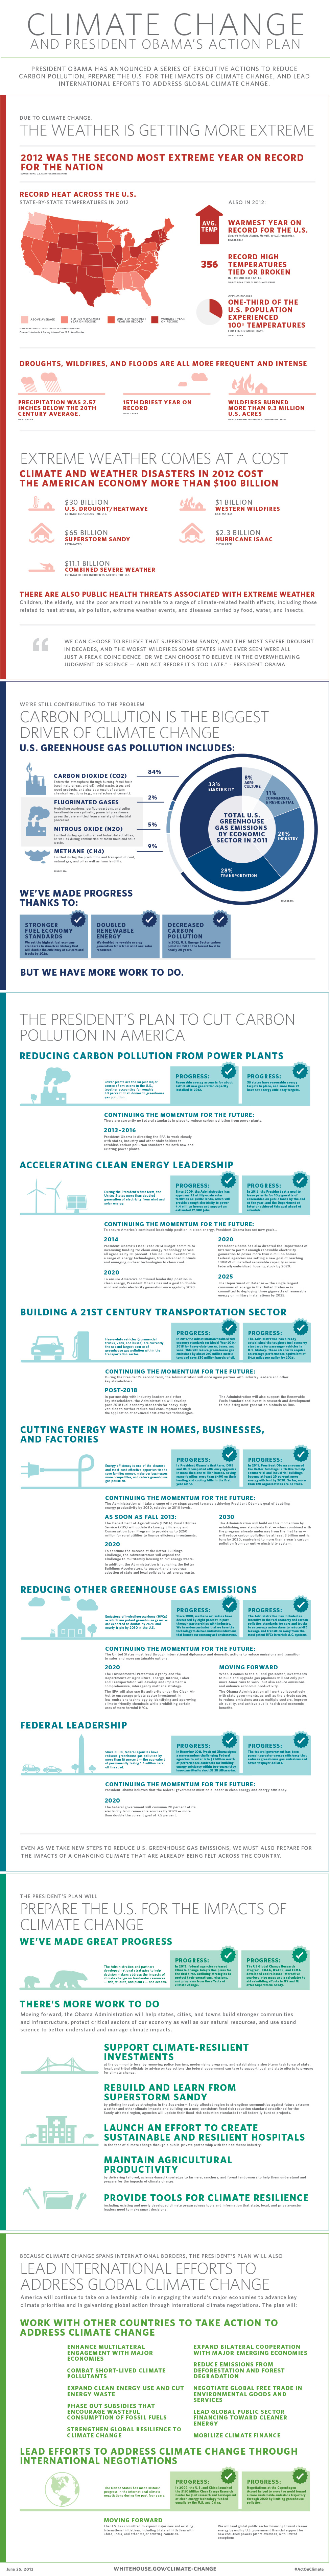
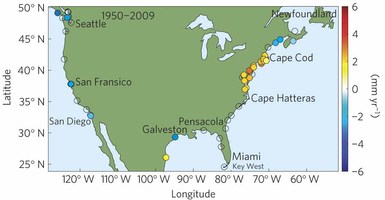
, which shows clearly that the West Coast and East Coast of the USA have already experienced much different responses to SLR. The data seems to be in line with the models, where a model projection is what is shown in the webapp. Another great visualization!

Share this:

  • Click to email a link to a friend (Opens in new window) Email
  • Click to share on X (Opens in new window) X
  • Click to share on Facebook (Opens in new window) Facebook
Tags: data visualizationglobal warmingimpactssea level rise

Click for more  

UNC Charlotte Homepage

Campus Links

  • Alerts
  • Jobs
  • Make a Gift
  • Maps / Directions
  • Accessibility

Resources

  • Alumni & Friends
  • Faculty & Staff
  • Prospective Students
  • Community
  • Current Students
  • Parents and Family

Stay In Touch

facebook instagram flickr linkedin twitter youtube maps

The University of North Carolina at Charlotte
9201 University City Blvd, Charlotte, NC 28223-0001
704-687-8622

© 2017 UNC Charlotte | All Rights Reserved
Contact Us | Terms of Use | University Policies
Skip to toolbar
  • Log In