USA

Robust features in the 2014 USA forecast

Building on a previous discussion about a seasonal forecast product from NOAA Climate Prediction Center (CPC), I am still really curious about how robust the features in the seasonal weather patterns in the USA are. “Weather” in this case is referring to temperature and precipitation (T and PCP), and features refer to 3-month boxcar averages of T and PCP anomalies compared to the corresponding 3-month climatologies. So this is not the normal day-to-day weather or even the recent weather. Here are some new figures, which I explore below in terms of features that seem to be “robust” and features that seems to be “ephemeral”.

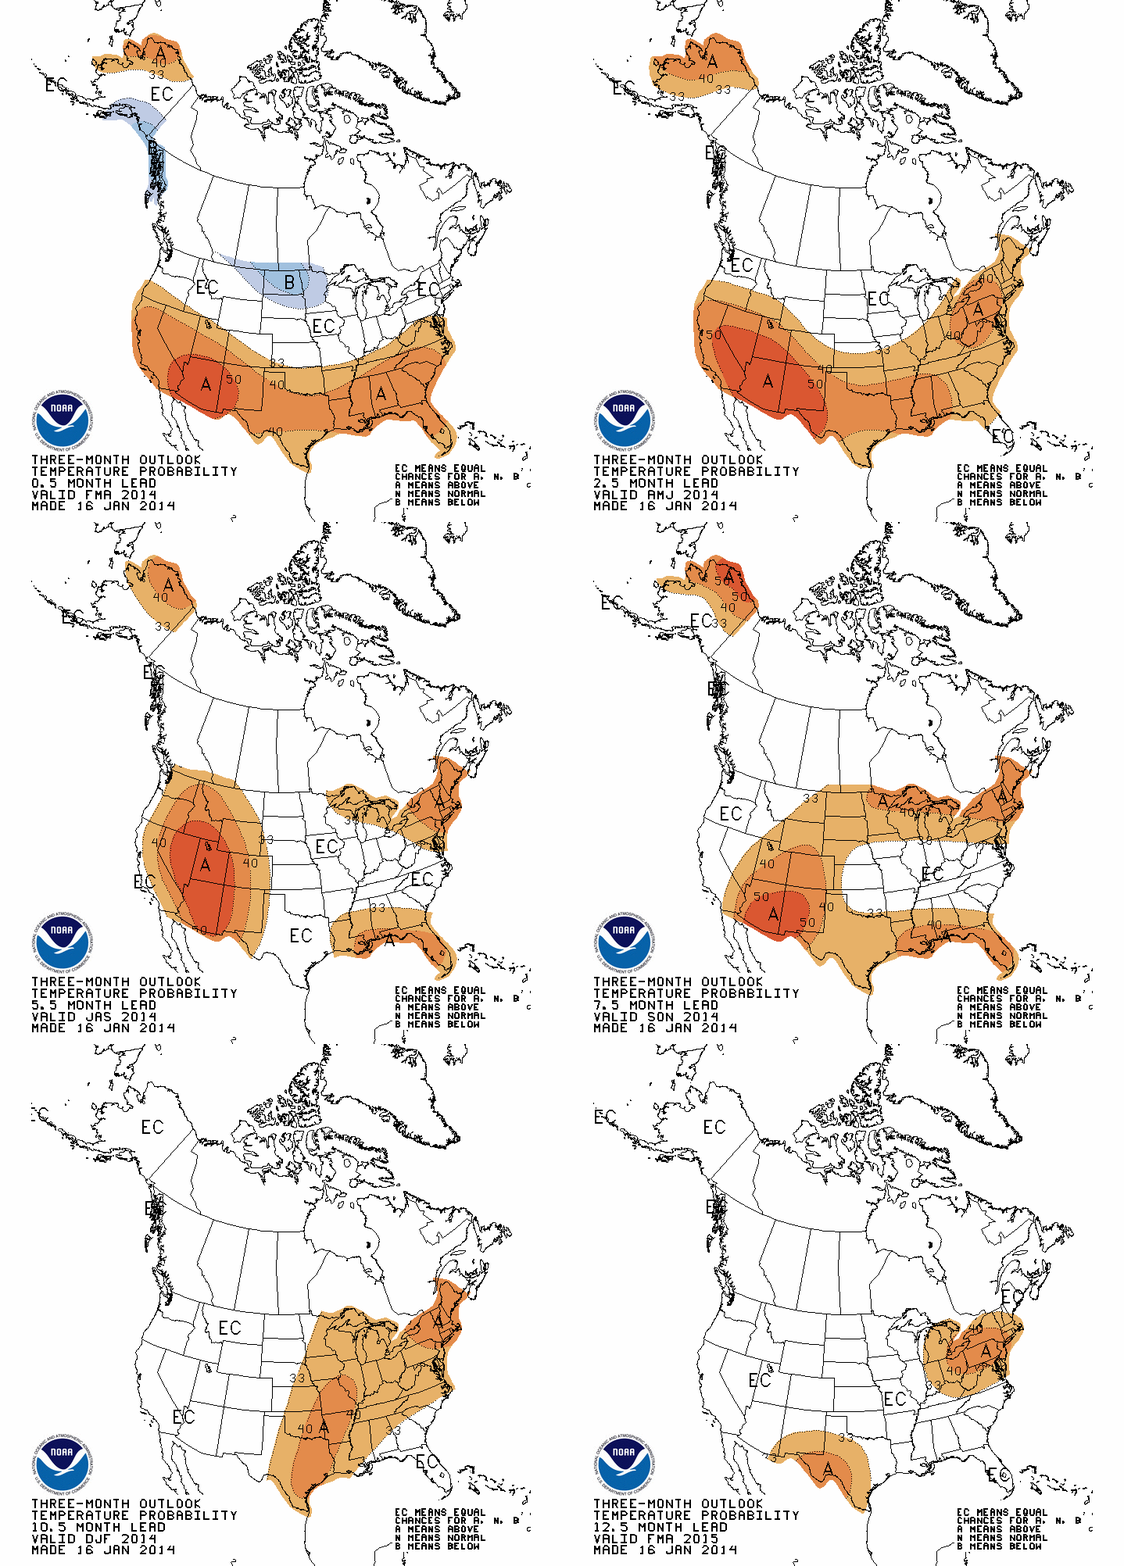
First, temperature in two plots:
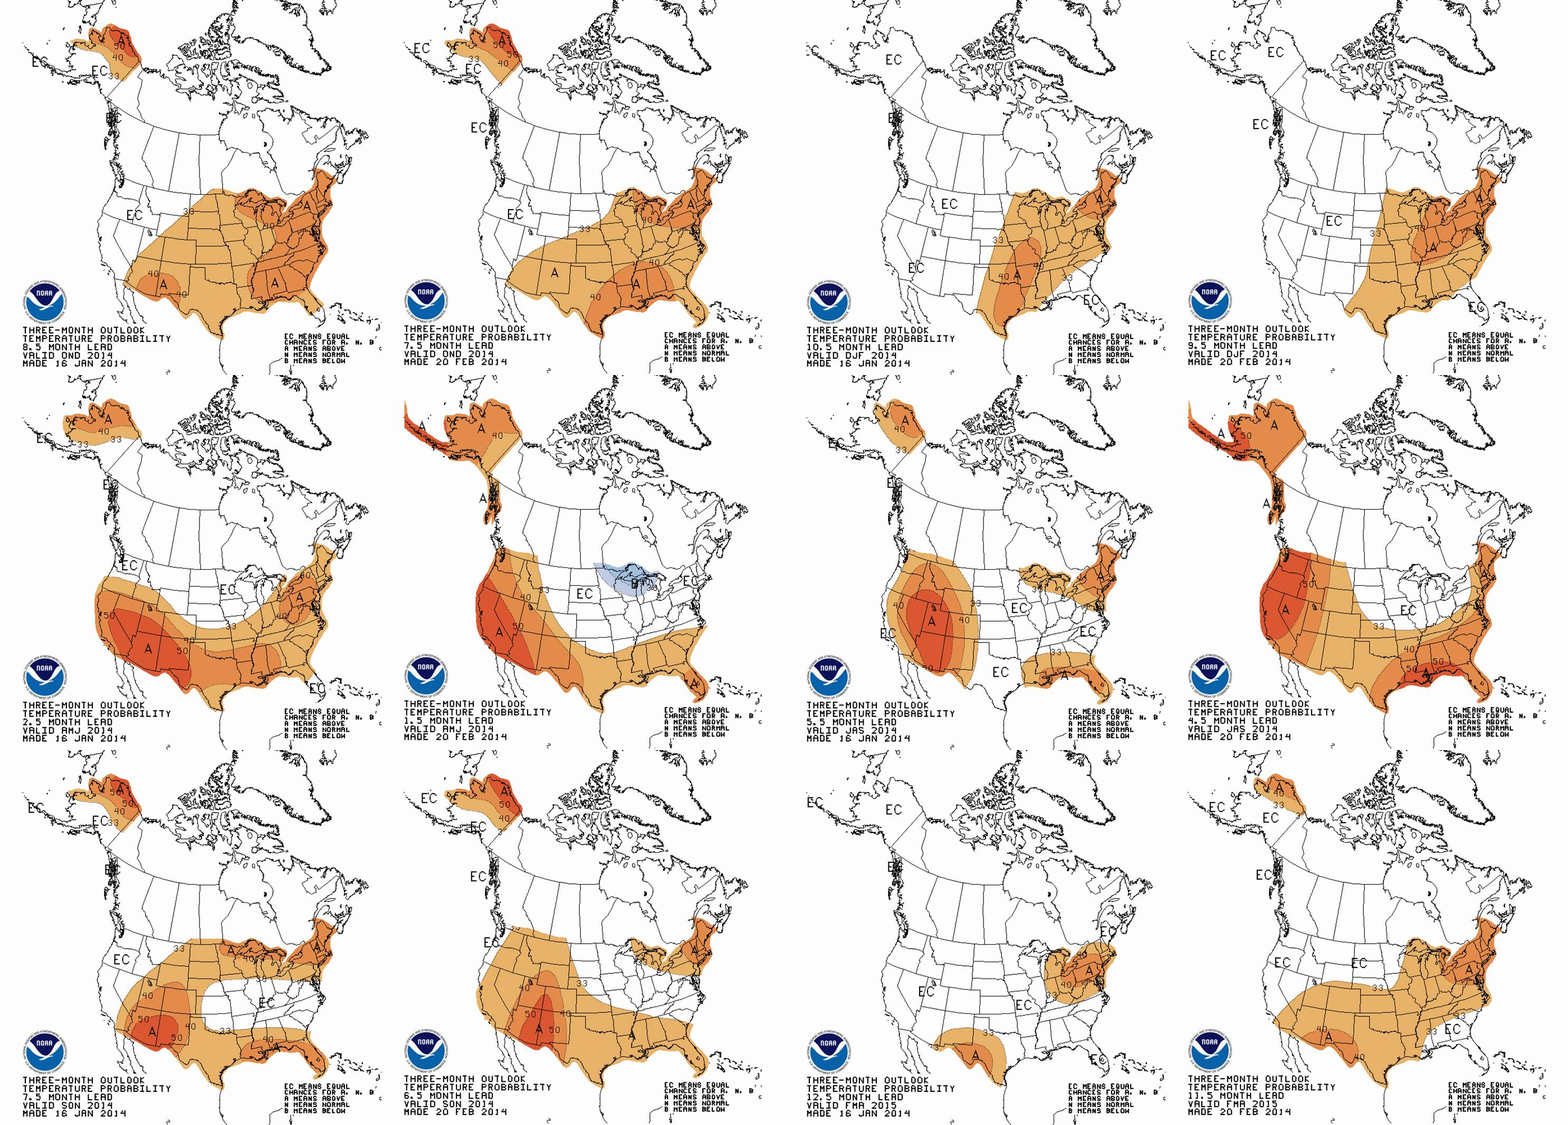
comparisons-2014-3-start

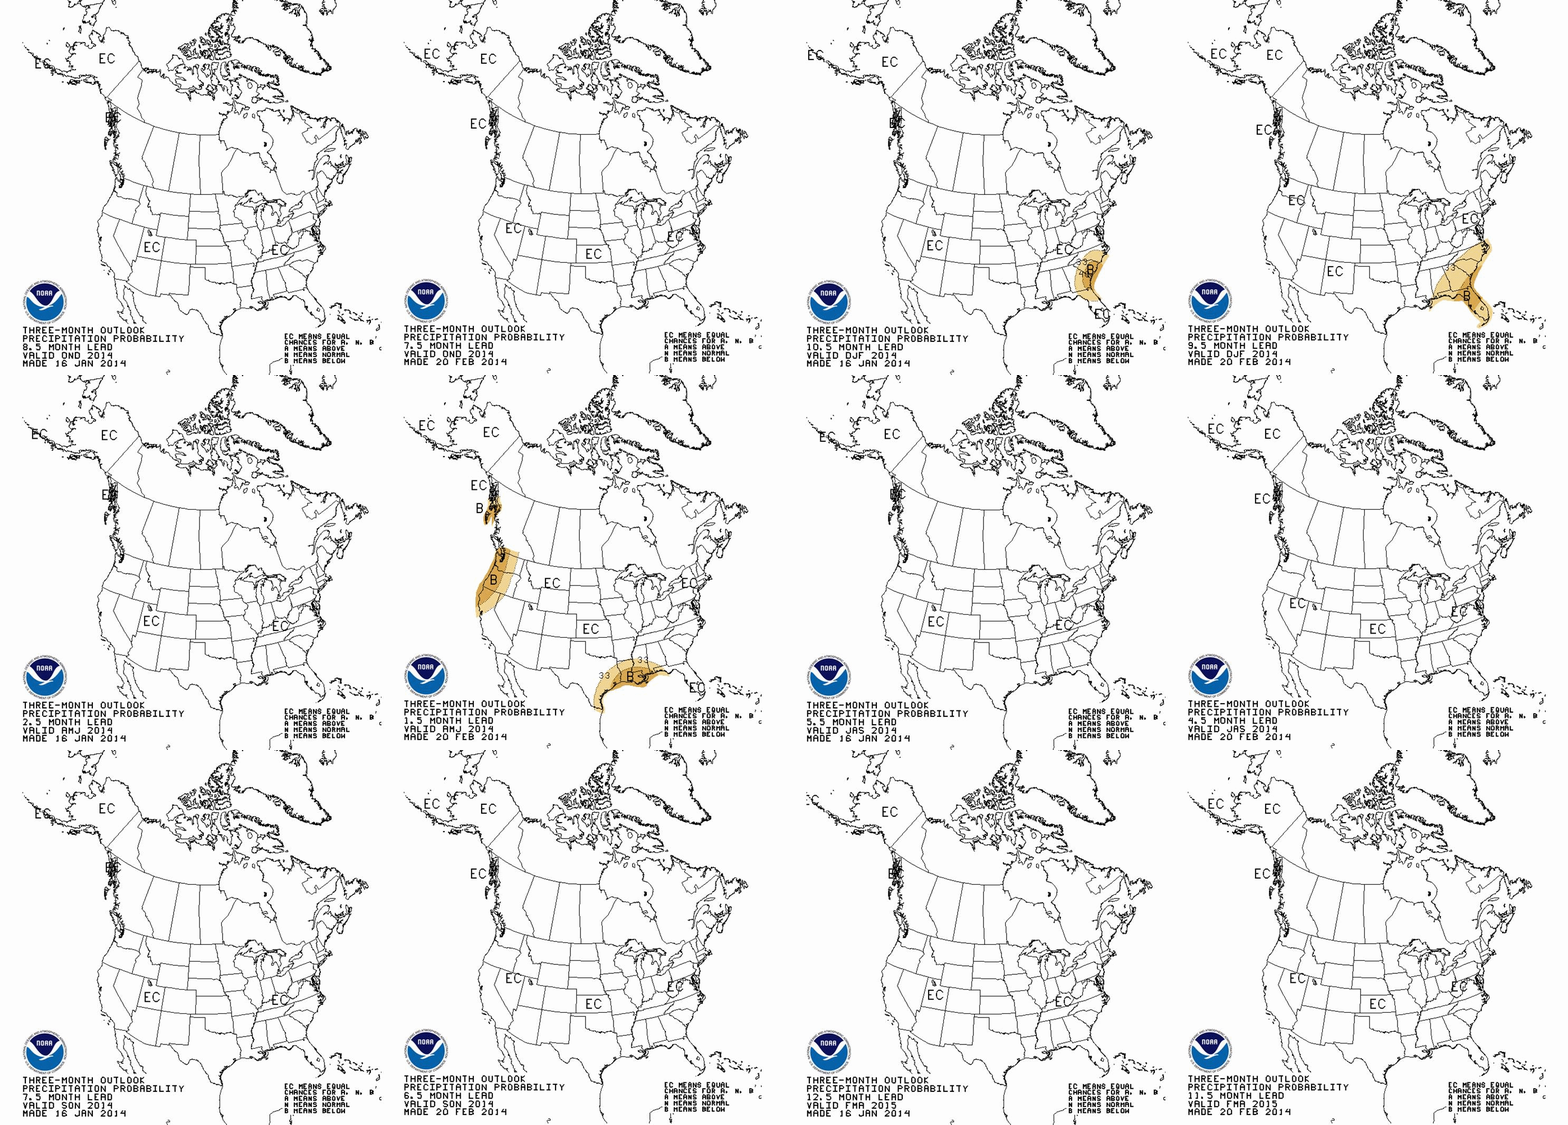
Then, precipitation in two plots:

comparisons-precipitation-2014-3-startWatch the figures carefully. All the animations start with a forecast for 3-month averaged T and PCP for March-April-May (MAM). Then, they step forward to April-May-June (AMJ)The CPC data product seems intended to provide an idea of whether T and PCP will be above or below average for the USA (including Alaska). In a previous discussion, I looked at CPC outlooks for 2014 and early 2015, and their figures and analysis were produced using actual mid-January 2014 conditions.

New data

Now another month of data is in and CPC has updated their seasonal forecast to begin with mid-February 2014 conditions. A natural expectation is that the seasonal forecast would be better earlier in the overall forecast period. In other words, as the animation above progresses, the confidence in the forecast should decrease with time. Sometimes, however, larger patterns of atmospheric variability that emerge somewhere else in the world can exert some level of control on weather patterns (T and PCP) in the USA. El Nino-Southern Oscillation (ENSO, or sometimes just “El Nino”) is the best known example.

There could be all sorts of speculative lines of thinking in terms of causes, so for now, I’ll focus on the features that seem to hold up after another month of data. I’ll call these robust, and point out one overall theme that is worth watching as winter releases its grip on much of the USA.

Robust Features

The Southwestern USA and often the Western USA in general is facing what will likely be a warmer than average year until about October. I think this is a pretty safe prediction. There is almost no evolution after more data was considered, except perhaps that the Pacific Coast tends towards higher probability of above average warmth. Upper Alaska is also holding up to the earlier forecast of warmth, especially in the northernmnost reaches. Both these regions are well known as fire prone under unusual warmth. Uh-oh. By November-December, the above average warmth shifts to the mid-Atlantic and the Southeast USA. The Northeast USA drifts towards unusual warmth starting in the summertime, maybe July, and ending about, oh, early next calendar year. For precipitation, much of the USA seems to be a normal water year. The problem is that in the near term, California remains dryer than average. Other features in a featureless prediction are that the deep South is dry in the spring, while the Ohio River Valley is wetter than average. Northern Florida and the coastal SE USA tend towards dry late in the calendar year.*

Summary and What the AVERAGE Year Looks Like

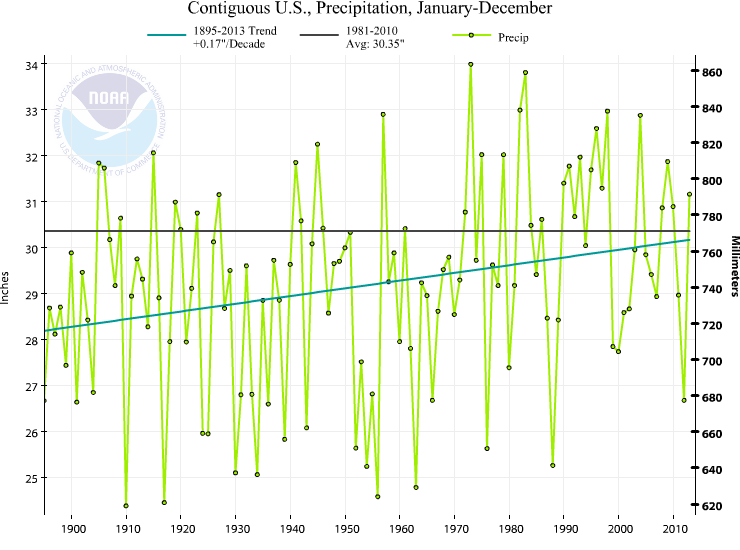
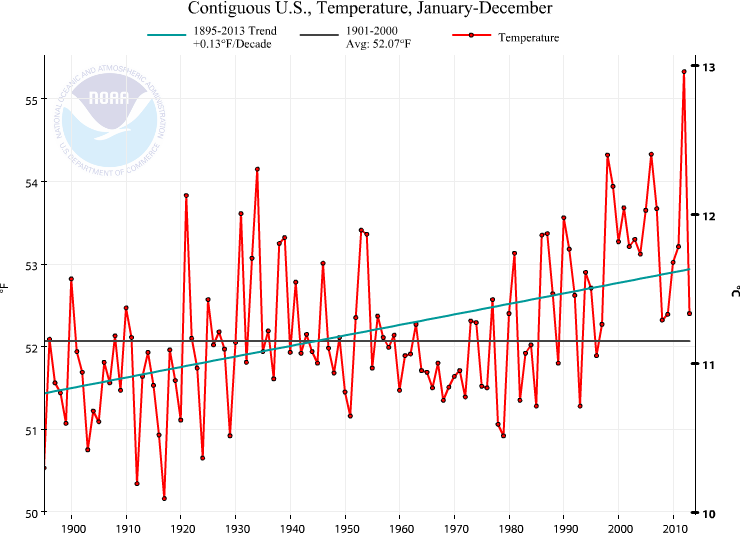
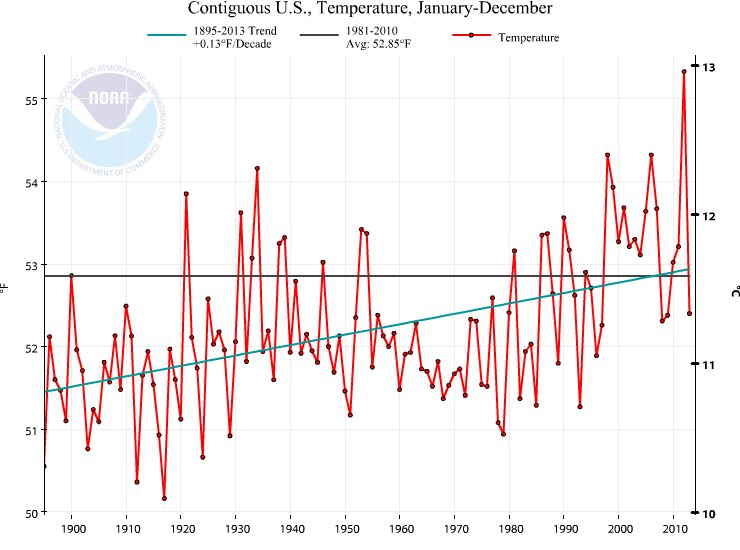
Overall, the story remains clear: The USA should experience another warmer than average year. Warmer than average is a relative term. Remember that NOAA (and CPC) define the normal temperature and precipitation amounts by the 1981-2010 30 year average. This is a particularly irritating 30 year timeframe mainly because climate is clearly warming most rapidly during the 1970 to present day period. It is what it is, but sometimes the simpler message is lost. The CPC forecast is for a year that is warmer than the 1981-2010 average. So what is the 1981-2010 average?? This is what the 1895-2013 temperature and precipitation trends for the contiguous USA (no Alaska) from NOAA NCDC with the baseline average 1981-2010 average temperature overlaid.contiguousUSA-1895-2013-annual-TcontiguousUSA-1895-2013-annual-PThe precipitation is not the story, in my mind. The story is that we should expect a warmer than 1981-2010 year. The average of 1981-2010, without doing any math, is clearly warmer than most of the years this past century. Quickly eyeballing this number says that 82 of the 100 years in the last century are colder than the 1981-2010 average. This is really important in terms of perception of the significance of a warmer than “average” year. 1981-2010 is not a very good choice for the “average”. Gonna be a warm year according to CPC. Nowhere is there a robust and spatially significant feature suggesting below average temperatures, by the way.
*There are a few features that are not that robust, by my admittedly weak definition. For example, it’s not that clear whether the NE USA or the NW USA will tend warmer than average in the early summer. And precipitation has about the same number of features that are robust as not robust.

Forecasting the USA temperature and precipitation tendency for 2014

Where we are this calendar year

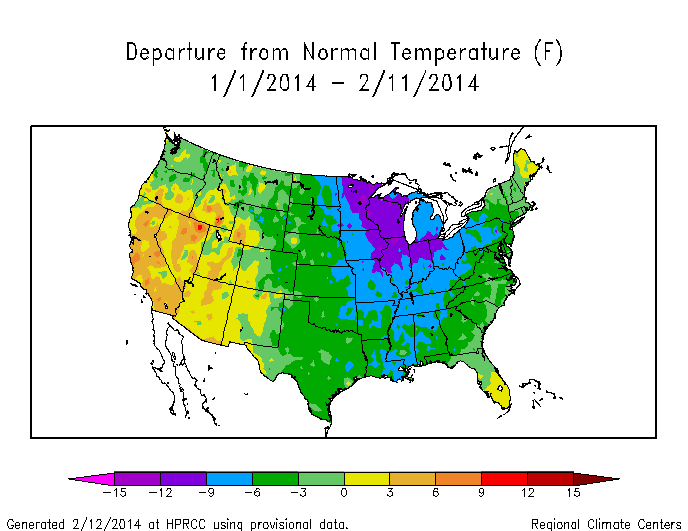
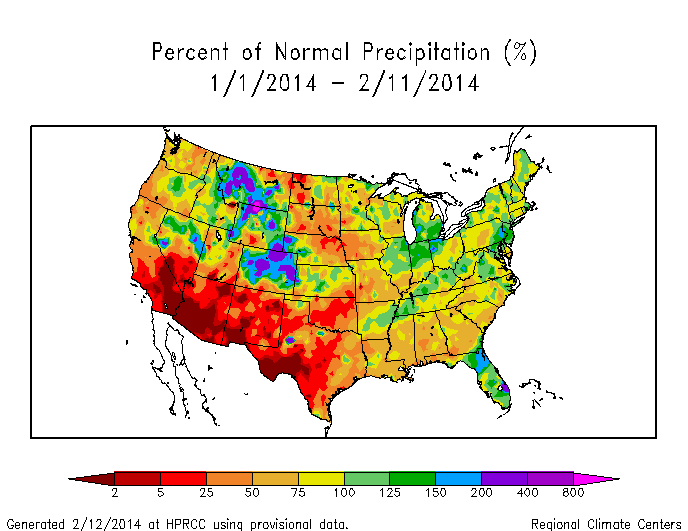
Currently, the USA as a whole and the Southeastern USA are both cooler than normal this year 2014-02-12-YearTDeptUS and precipitation is slightly below average for the Eastern USA, above average for Colorado-Wyoming-Idaho, and well below average for the Southwestern USA. 2014-02-12-YearPNormUS
Where we are right now

Thinking about the upcoming year in weather while in the midst of a crippling snow/ice storm in the Carolinas (discussion via #NWSGSP, over 2,000 outages by end of 12 Feb 2014 mostly in Lancaster, Greenville, and Pickens Counties in SC, and Macon and Caswell Counties in NC*, flights cancelled, Rayleigh-Durham turning into a parking lot like Atlanta only two weeks ago, etc.) is the perfect time to test whether you can separate a trend from variability (teach me, dog walker).

*updated on 13 Feb 2014 midday is 36,400 outages; more than 14,000 in Mecklenburg, 4000 in Cabarrus, 2700 in Gaston, 1600 in Rowan, 1300 in Lincoln, and 1100 in Durham County, NC. About 5000 in Lancaster and 2900 in Chester County, SC. Wow. Second band of snow falling in North Mecklenburg dropped maybe another 6″ on the 5-6″ we had yesterday. Double wow. Snow and ice totals should be impressive after the analysis is complete.

Trend, variability, and perception

The temptation is that your opinion is tempered by what you are currently experiencing. The old and boring argument that “Hey, it’s cold. What’s up with global warming?” The short-story (pun intended) is that weather is always variable, and the #SEStorm snow and ice storm is no exception.

What is the trend? Globally, it’s simple. Temperature is increasing (NASA GISS, UK Met Office CRU, NOAA NCDC). For the USA, and states within the USA, it’s less simple. Variability in the weather tends to average out less and less over smaller and smaller spatial scales. What does this mean? The ups and downs we expect from weather like our February snow/ice storm and the preceding week with beautiful warm temperatures become less and less noticeable at larger spatial scales because while North Carolina might be down in temperature, somewhere else on Earth is certainly up on temperature. They average out unless there is an overriding trend, like the trend imposed by increases in greenhouse gases. That’s why the global temperature trend is so important. If something is making the entire Earth warm above what is considered a range of natural variability, then some very powerful mechanism is at work.

Where we might be this calendar year

Back to the question at hand though. Can science address near-term (say, over the next 3-12 months) temperature and precipitation? The answer is yes, and this prediction is studies using an analysis called seasonal forecasts. I was shocked by what is suggested for temperature for the rest of 2014 and slightly into the beginning of 2015. NOAA Climate Prediction Center (CPC) updates their seasonal forecasts about the middle of every month, and I put this animated version of their graphics together below. temperature-2014-01-16where, once you wrap your head around what I call the “geography” of the figure, you see that NOAA CPC is predicting whether the temperature over successively farther 3-month periods (Feb-Mar-Apr, Mar-Apr-May, etc.) will be above, at, or below the average temperature for 1981-2010 (the climate normal). Clearly, NOAA CPC analysis is suggesting that the USA is due to experience an above-average year for temperature. In particular, the Southwest and Alaska are pummeled by warmer-than-average temperatures until October (a hot summer in the Southwest is not pleasant, and hot summers in Alaska may be suggestive of a bad fire year). Furthermore, by about October-November, the forecast for the Southeastern USA is to be above average temperature even after the rest of the country goes to even chances for above or below-average temperature. That translates to a nice Halloween and Thanksgiving in the short-view, and yet another warm blip on the global warming trend in the long-view.*
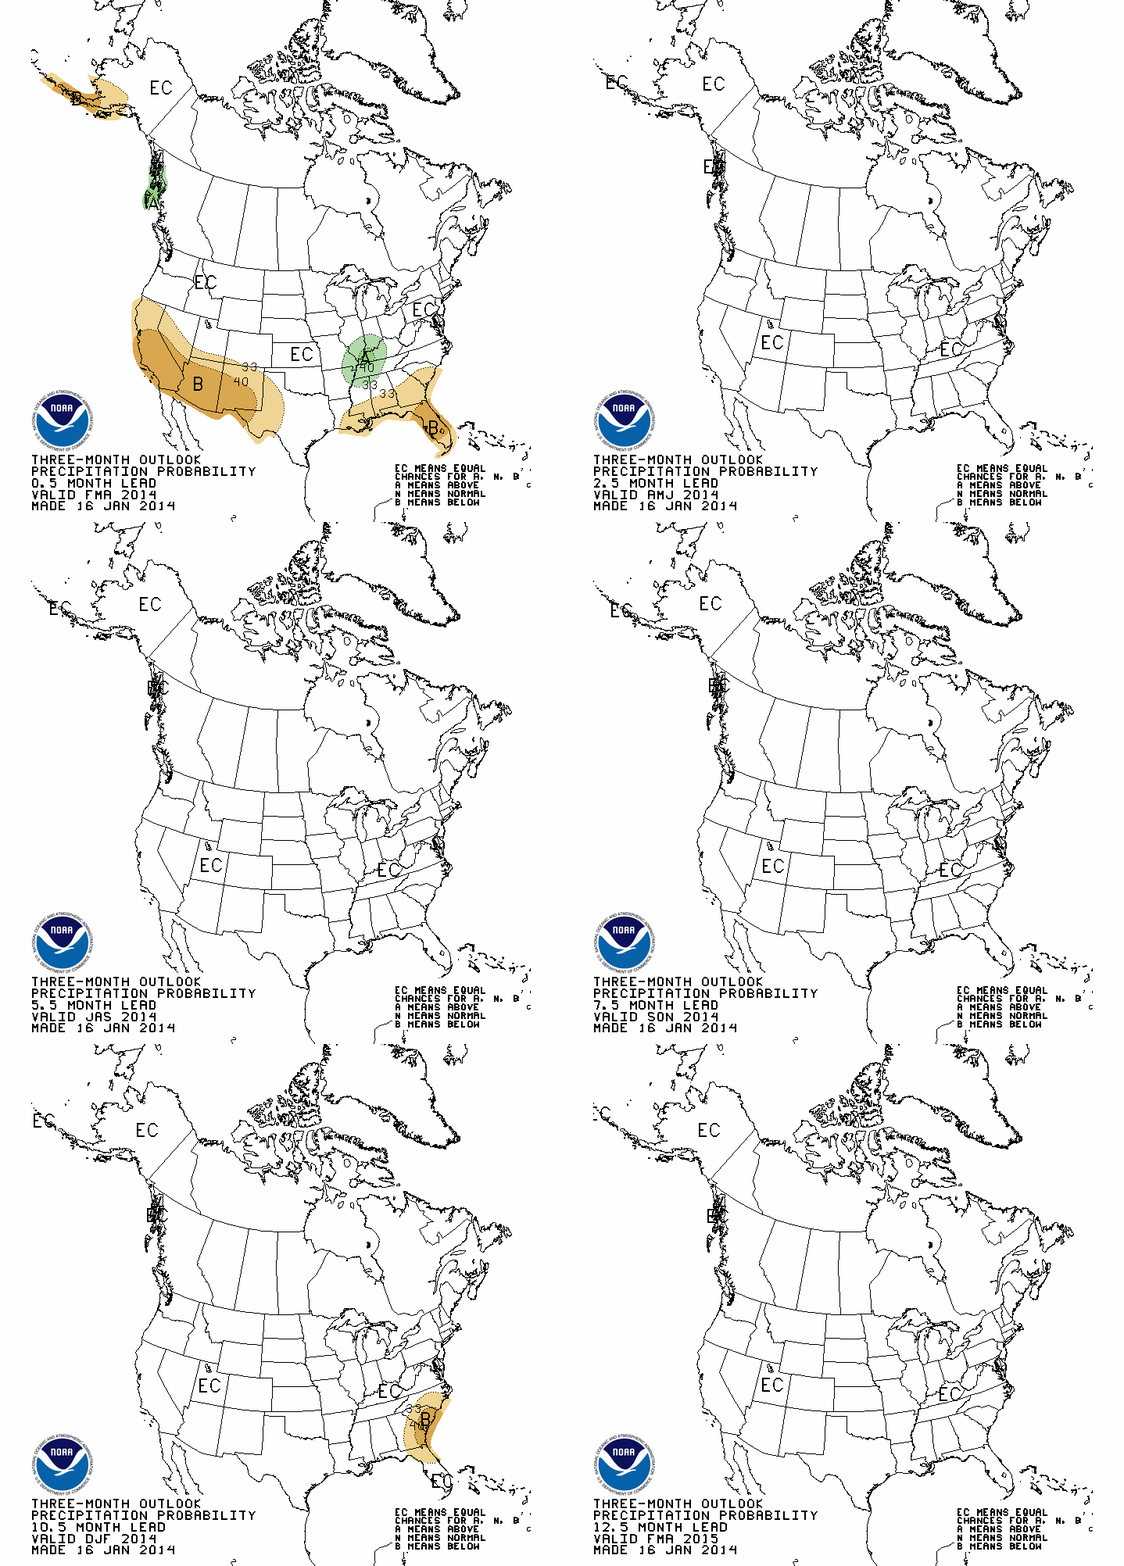
Precipitation seems to be less interesting in terms of climatological deviations, but the Southwest does seem to at least move away from below-normal, dry conditions that are plagueing California right now. precipitation-2014-01-16

*I’ll revisit the seasonal forecasts again in a couple of weeks after NOAA CPC updates their analysis, and then also look at how well the forecasts capture reality at the end of the year using NOAA NCDC archived temperatures. This verification is mainly because I haven’t spent much time with these seasonal forecasts, but I am always seeking out new media for the classroom. A natural question about the NOAA CPC products is: Are they any good? We’ll see.

Summary

A lot to digest, and time will tell, but don’t let this cold early part of 2014 deceive you. Global warming is a major trend that is imposed on every weather system in the world. No single weather events is very likely attributable to global warming because of the complexity in parsing out all the causes and effects that modulate a weather system as it tracks through the USA (think of how tricky the forecast of ice vs snow was for this Feb 11-13 storm, and then try to say what it was that caused that specific location of the border between the two – hard!). But the average weather is slowly changing, and the average weather is climate. In the meantime, back to staring at the sleet that is falling and wondering when UNC Charlotte will open again for classes!

Climate in the Southeast in January 2014

Scientists studying the Earth’s climate system are supported by an immense and rich array of data. Sometimes it seems like you only have to be comfortable working with all this information. Programming languages help (matlab, R, python, NCL, for example). But even more accessible are incredible web resources. The USA High Plains Regional Climate Center updates their climate and weather relevant maps on a daily basis. Here are some figures showing where the country and the southeast USA stands. From NCDC time series plotter, the contiguous USA (no Alaska and Hawaii) was the 37th warmest year in the last 119 years, as shown in the graph below.
contiguous-USA-2013-T
In itself, 2013 wasn’t unusual. In recent memory, 2008 and 2009 were really similar to 2013. However, compared to the fanfare around the hottest year on record for the USA in 2012, it does seem different. Who can remember ought-8 and ought-9, right?

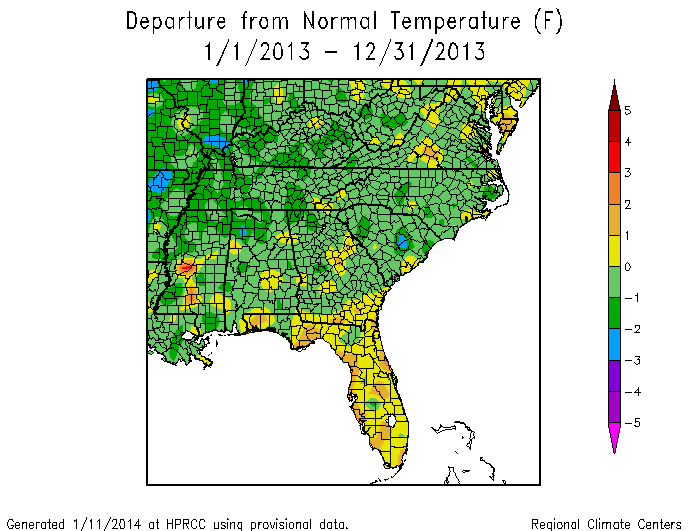
But even more to the point is what we feel where we live. Science and statistics are fine, but just like no one on Earth experiences the average global temperature, no one in the USA experiences the average USA temperature either! Let’s look at the Southeast. In 2013, drawing from the HPRCC link above for the figures below, the temperatures were cooler than average.
AnnDec13TDeptSERCC-2013-12-31
In the last 120 years, 2013 in the Southeast was about the 67th warmest. Most of the years in the past 120 years have been warmer! But this is really not that ususual. 4 of the last 10 years in the Southeast have been cooler than more than half the past 120 years. 10 years is a limited view, but I chose it because it’s a round number and because we remember the last 10 years. Going back to the USA, *none* of the last 10 years have been cooler than more than half of the past 120 years. Not really even close. You can verify this with NCDC data tools. What global warming? Well, that’s where perception matters. The Earth is warming, even if the Southeast seems to be avoiding the problem we’ve created with CO2 emissions.

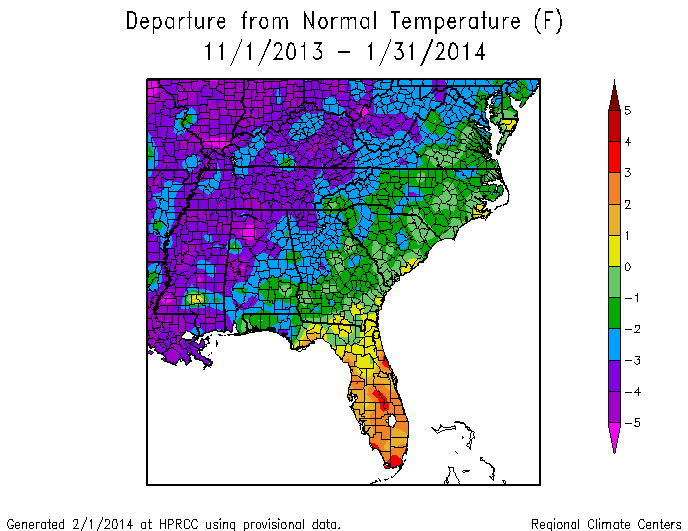
Looking to the more recent period, we can also glean a little bit about our winter months with a 3 month average (Nov-Dec-Jan) using HPRCC again
Last3mTDeptSERCC-2014-01-31
We see that except for Florida, the Southeast is largely cooler than average. Here HPRCC is comparing against the 1981-2010 average temperature (temperature anomaly). Appalachia and further to the west are in a deep recession of the warmth we expect when we think of global warming.

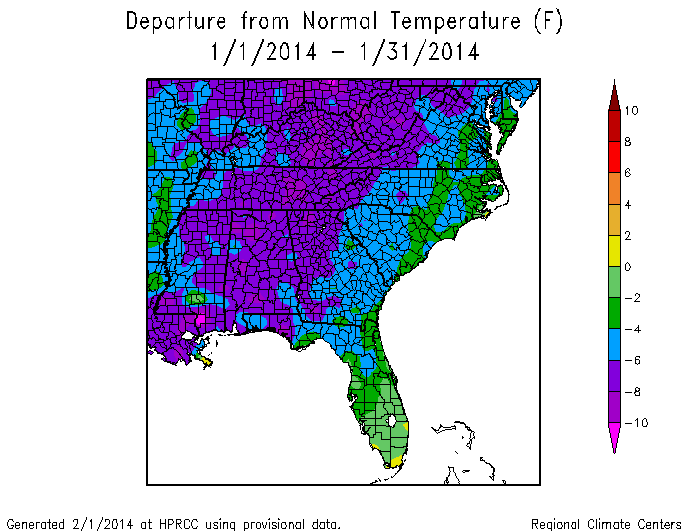
Finally, we can look at January 2014 using HPRCC tools.
Last1mTDeptSERCC-2014-01-31
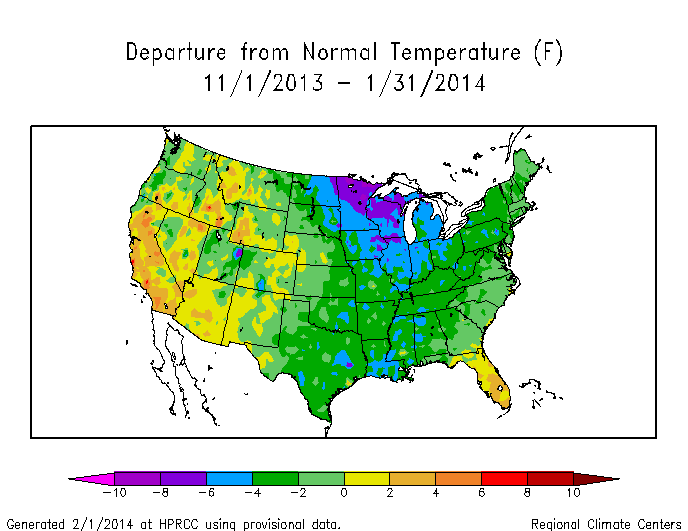
The Southeast is cold! Even poor Florida, which over the last 3 months is anomalously warm compared to the rest of the Southeast, is in a deep cold this past January. If we eyeball-average the data on the figure, we get a number of about 6-7 degrees F below the 1981-2010 average. Jeez. Where can we go for unseasonable warmth (retrospectively)? The West is certainly above average, and more importantly below average on precipitation, as the figures show below.
Last3mTDeptUS-2014-01-31
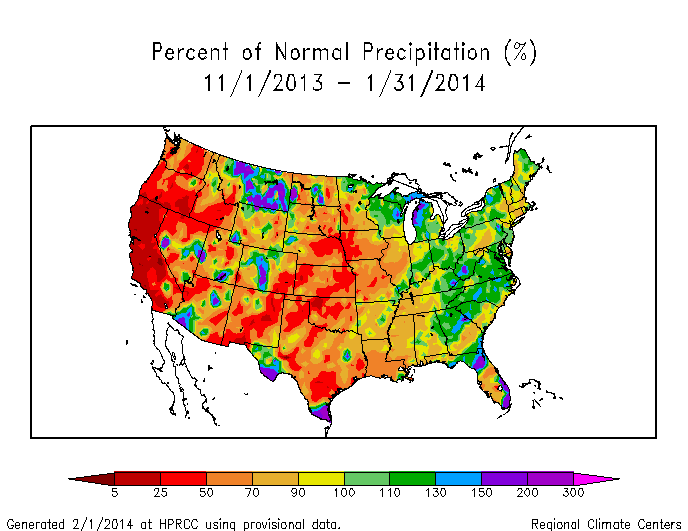
Last3mPNormUS-2014-01-31
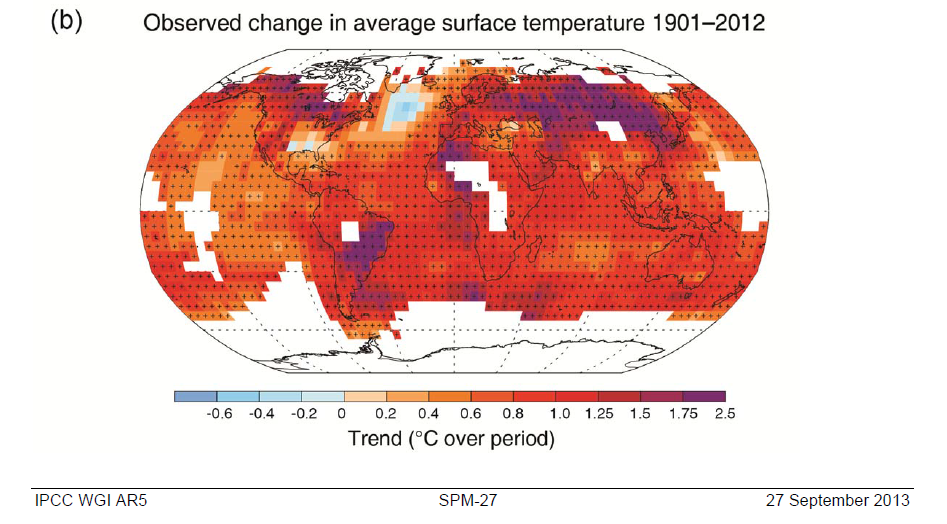
Be thankful the Southeast is so stubbornly refusing to budge on global warming… but I worry that as a result of this stubborness, our legislators will forget this is a problem. North Carolina will be affected even if we are a hold out for now. Think global whenever you think of climate. Or, if you want, think of Bob Marley (one love, one heart). This figure from the recent IPCC report (WGIAR5-SPM_Approved27Sep2013) shows that there are only a couple of non-red areas on Earth (ie. they are not following the warming trend). The Southeast is one of them! But that is one scorched Earth otherwise.
ipcc-ar5-wg1-spm-fig1

Charlotte Citizens Hearing on EPA Proposal to Regulate Carbon Emissions

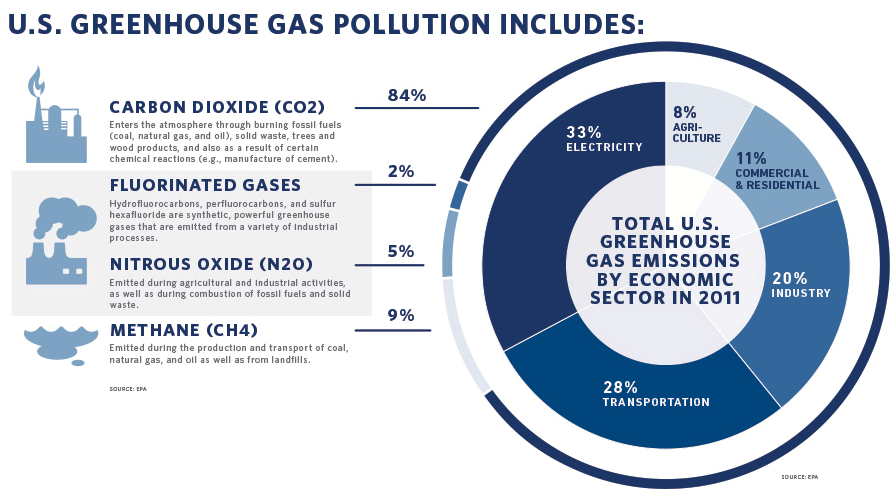
Real conversations about how we can act on climate change (#ActOnClimate) seem to be happening right now. Environment North Carolina published their tabulated emissions from state power plants, and even highlighted North Carolina’s role in this.ghg-largeTo offer public support for the EPA proposal to limit carbon emissions from any new power plant, Clean Air Carolina and NC Conservation Network are hosting a Citizens’ Hearing in downtown Charlotte on Tuesday October 15 from 6-7:30pm (more info below). Charlotte Observer noted the event, and the general public is invited to participate. I will attend and offer brief remarks about the climate science behind the EPA proposal. Please join us and support the proposal to FINALLY regulate some of the emissions from any new power plants. This discussion will set the stage for the presumably upcoming/inevitable proposal to regulate emissions from existing power plants the EPA should have ready next year. From the Clean Air Carolina post:

Last week, the Environmental Protection Agency (EPA) announced its first steps under President Obama’s Climate Action Plan to reduce carbon pollution from power plants. The EPA will soon hold hearings in various cities at which the public can comment.

For decades, public participation has become a regular and important part of how new laws are carried out. As an alternative to attending an official EPA hearing, communities across the country will hold “Citizens’ Hearings” and all comments will be recorded and sent to the agency as official public record. Clean Air Carolina and NC Conservation Network are hosting the Charlotte Citizens’ Hearing on Tuesday, October 15 to allow area residents the opportunity to provide oral testimony on the new rule.

Charlotte Citizens’ Hearing
October 15, 2013 – 6:00 p.m. – 7:30 p.m.
Caldwell Presbyterian Memorial Church
1609 East 5th Street
Charlotte, NC 28204
RSVP today and let us know you’re coming!

Cleaning up power plant pollution will result in better air quality, healthier communities and a major reduction in climate changing pollution. Just today, the world’s top climate experts have announced an upper limit on carbon emissions that they warn we cannot pass if we are to avoid the most dangerous effects of a warming planet. Join us for the Charlotte Citizens’ Hearing to show your support for strong carbon rules on new and existing power plants! See below for Citizens’ Hearings scheduled in other NC cities.

The Climate Change Speech transcript and video

Here’s an update from my post yesterday about the Climate Change Speech. Link to the video on Youtube via whitehouse.gov. The video is downloadable (mp4) so you can show students how a speech embodies leadership on an issue that will, in my opinion, define this and the next generation. Link to the transcript of the speech at Georgetown University.

When I review the transcript, I think about the speech Margaret Thatcher gave to the UN in 1989. Thatcher opened her speech about global warming with the voyages of Charles Darwin. Obama opened his speech with the voyages to space by US astronauts.

President Obama said on a hot summer day (92 F air, 67 F dewpoint means about 96 F heat index) in Washington DC in June 2013

On Christmas Eve, 1968, the astronauts of Apollo 8 did a live broadcast from lunar orbit. So Frank Borman, Jim Lovell, William Anders — the first humans to orbit the moon -– described what they saw, and they read Scripture from the Book of Genesis to the rest of us back here. And later that night, they took a photo that would change the way we see and think about our world. It was an image of Earth -– beautiful; breathtaking; a glowing marble of blue oceans, and green forests, and brown mountains brushed with white clouds, rising over the surface of the moon. And while the sight of our planet from space might seem routine today, imagine what it looked like to those of us seeing our home, our planet, for the first time. Imagine what it looked like to children like me. Even the astronauts were amazed. “It makes you realize,” Lovell would say, “just what you have back there on Earth.”

Prime Minister Margaret Thatcher said in November 1989

During his historic voyage through the south seas on the Beagle, Charles Darwin landed one November morning in 1835 on the shore of Western Tahiti. After breakfast he climbed a nearby hill to find advantage point to survey the surrounding Pacific. The sight seemed to him like “a framed engraving”, with blue sky, blue lagoon, and white breakers crashing against the encircling Coral Reef. As he looked out from that hillside, he began to form his theory of the evolution of coral; 154 years after Darwin’s visit to Tahiti we have added little to what he discovered then.

What if Charles Darwin had been able, not just to climb a foothill, but to soar through the heavens in one of the orbiting space shuttles? What would he have learned as he surveyed our planet from that altitude? From a moon’s eye view of that strange and beautiful anomaly in our solar system that is the earth? Of course, we have learned much detail about our environment as we have looked back at it from space, but nothing has made a more profound impact on us than these two facts.

First, as the British scientist Fred Hoyle wrote long before space travel was a reality, he said “once a photograph of the earth, taken from the outside is available … a new idea as powerful as any other in history will be let loose”. That powerful idea is the recognition of our shared inheritance on this planet. We know more clearly than ever before that we carry common burdens, face common problems, and must respond with common action.

And second, as we travel through space, as we pass one dead planet after another, we look back on our earth, a speck of life in an infinite void. It is life itself, incomparably precious, that distinguishes us from the other planets. It is life itself—human life, the innumerable species of our planet—that we wantonly destroy. It is life itself that we must battle to preserve.

I could read those words over and over again and never feel any less attached to the idea of a global community and the potential role that science can play in achieving this goal. After yesterday, the goal seems attainable.

President Obama takes the offensive on climate change

Categories: Group News

Wow. What a speech this afternoon by President Obama on the Georgetown University campus – and a beautiful follow up to his Inaugural Address in January and his State of the Union speech shortly thereafter – noting one satire piece that is worthy of watching. He stepped onto the stage at about 2pm Eastern time and delivered. The backbone was the announcement of the President’s Climate Action Plan (click for PDF). The papers were buzzing – Washington Post for example but there were many many more “responses” to the unveiling of the Climate Action Plan. Twitter was super active from about 2-5 pm Eastern time with #ActOnClimate trending high. I haven’t been around Twitter long enough to see the electricity flowing like this, but watching the speech and the tweets at the same time was pretty inspiring. Entertaining too. Twitter was like a race to see who could point out a quote by @BarackObama the fastest. Obama said a lot of great things, but I like this one.

We don’t have time for a meeting of the Flat Earth society

He pointed out that the Clean Air Act only promoted American innovation and did NOT destroy the economy, and noted that the Clean Air Act passed nearly unanimously with only ONE DISSENTING VOTE. Times have changed! He metaphorically referred to the economic potential of moving to clean energy as the building of a new engine, referring (I presume) to the innovation of the automobile industry in America throughout the 20th century. Clean energy is here in this country now. He said that 75% of wind energy is in Republican districts (!). The community organizer in our President emerged as he gave credit to past Republican efforts to help our environment – the EPA was created under the Nixon administration, for example.

I haven’t found the transcript or the high quality video yet, but June 25, 2013 was a very memorable moment for the USA. I hope it marks the turning point and that the USA leads – like it should, says this US Citizen – the development of a global community around the issue of global warming. I’ll leave you with an amazingly long graphic from the White House page.climate_change_report_62513_final_0

Interactive USA wildfire map from Climate Central

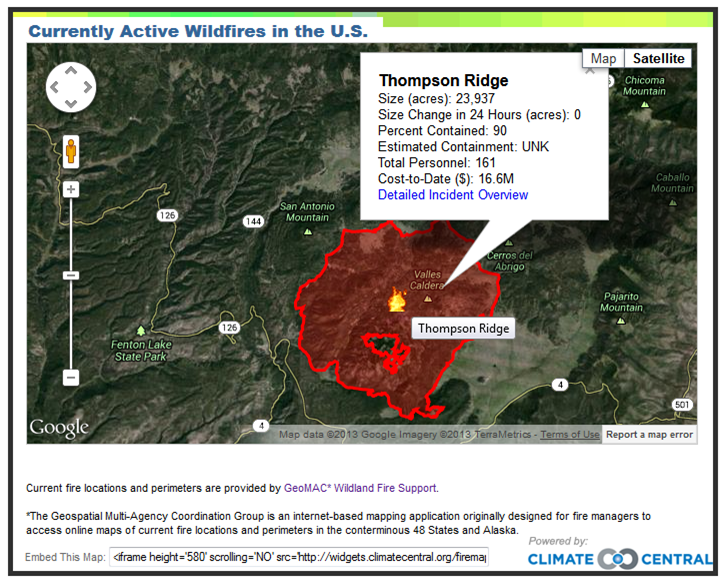
Amazing what a team of scientists, techs, and a pile of data will bring you. I tried to embed a great map interface by the group at Climate Central here, but it didn’t work so here’s a screenshot of the information the interactive map provides when you zoom into one of the large fires affecting the USA right now (this one near Los Alamos, New Mexico).climatecentral-firemapGo to their widget here or to the more detailed posting about the widget here. Essentially, Climate Central is posting updated USA (or maybe North America) fire locations with really useful (and frightening) details as they roll in from daily reports by fire and land managers. Respect and praise for this great product of the intersection between science, technology, and public outreach. I wish the fire crews the best as they battle against an unforgiving enemy.

May 2013 climate in North Carolina and the world

With global warming and all of the impacts, it’s very important to constantly consider the question of time and space scales. May 2013 is a good example for those of us living in the Southeastern USA or North Carolina. Namely, North Carolina’s normal-to-cool spring is not at all indicative of how the global temperature is evolving. Let’s see how we can quickly use NOAA NCDC graphs to figure this out.

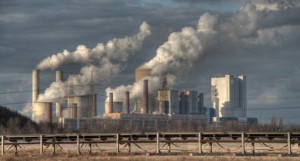
Global warming refers to the increase in average temperature of the entire Earth. The last part – the entire Earth – is the spatial scale. And that’s a huge spatial scale! When a scientist talks about global warming or that global warming has been detected, you have to step back and say WOW. What on Earth could warm an entire planet? coal_fired_power_plantOver long time scales, of course there are a number of possible reasons (changes in the Sun, Earth’s orbital shape/proximity around the Sun, plate techtonics), but these take so long, they aren’t relevant to the concept of global warming. Even my statement that What on Earth could warm an entire planet? should be more precise and say something like What on Earth could warm an entire planet over a relatively short time period? The simplest, if somewhat incomplete, answer is the combination of greenhouse gases and aerosols emitted into the atmosphere from human activities. Period.
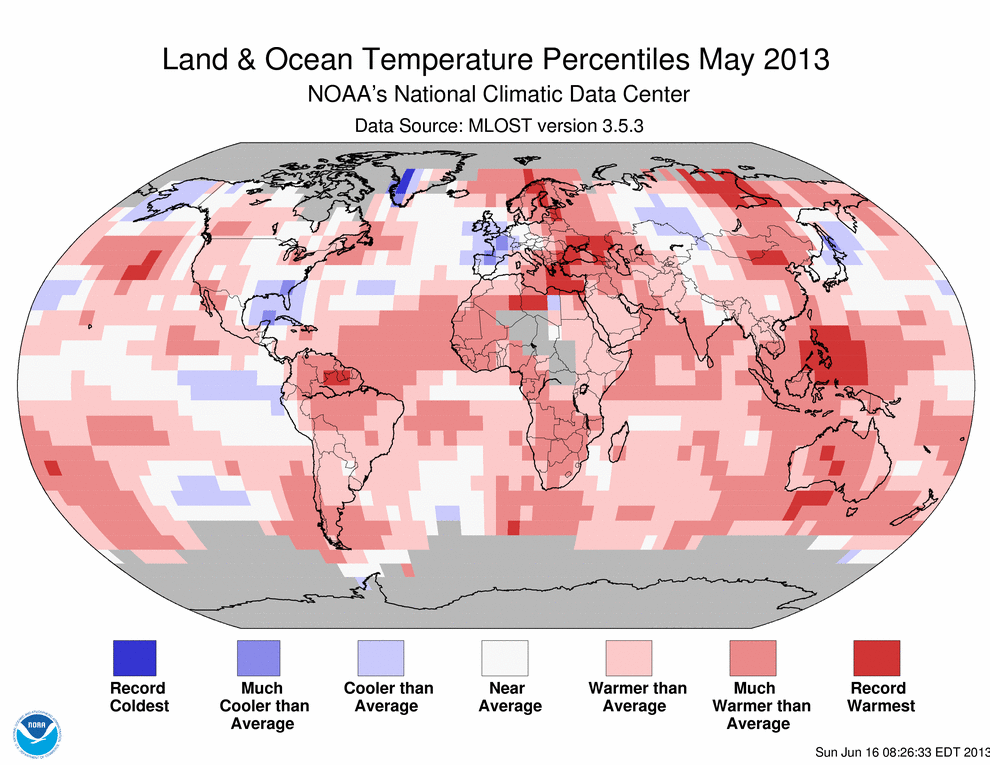
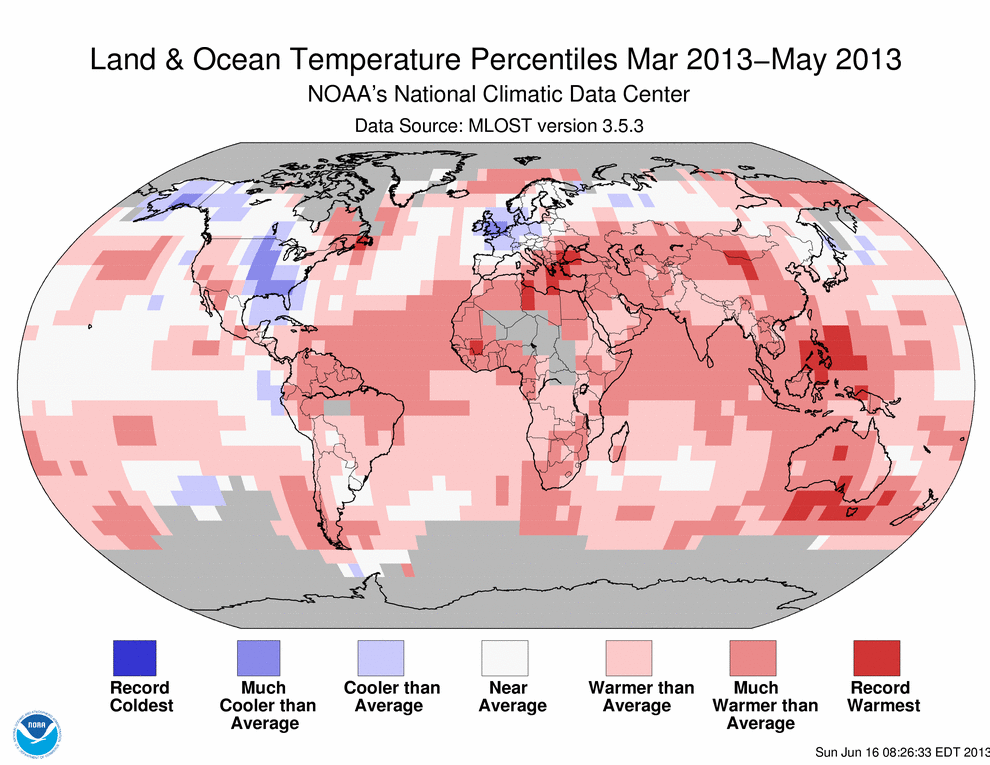
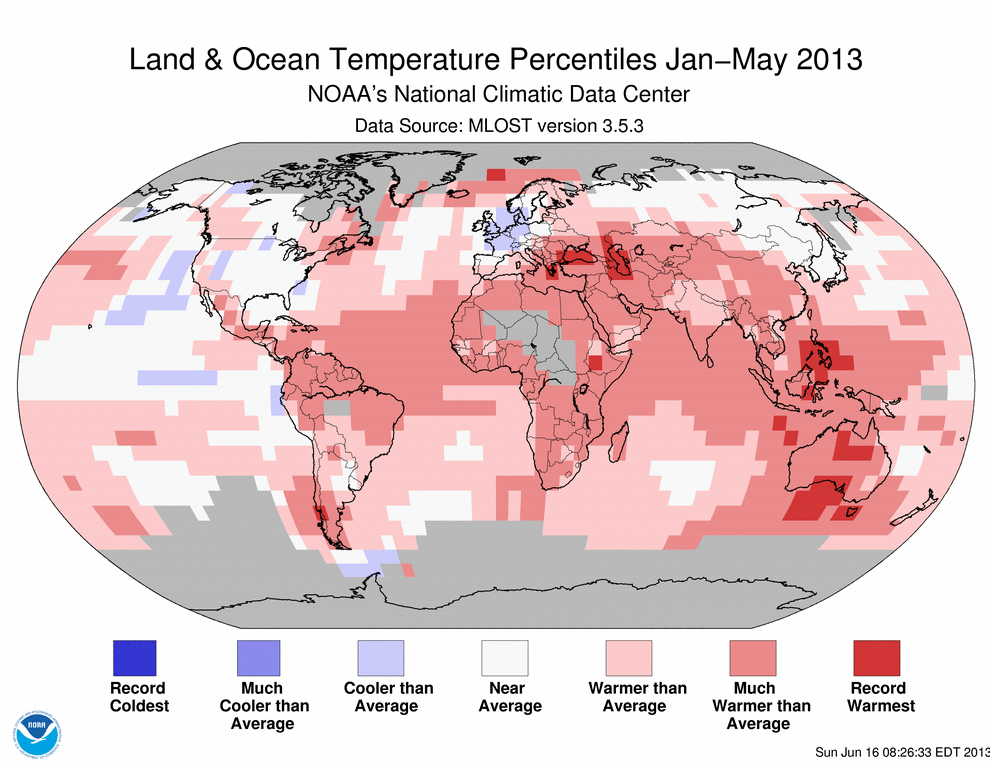
May 2013 analysis of global temperatures are trickling out. NOAA NCDC as always has a wonderfully complete report of climate news for May and for all previous months. My favorite part is the plethora of hyperlinks. NOAA NCDC should really be commended for their public outreach! Here is one of the figures from that webpage201305where you can see how different the Southeast USA is from the world in May 2013 – the world is shades of red, while the Southeast USA is shades of blue (cooler than normal). We’ve had a very pleasant spring in North Carolina. Pull back on the temporal (time) scale to see the March-April-May seasonal average201303-201305 and you can see that the cool spring extends well beyond May in terms of the anomaly. By this, I mean that the blues become deeper when you consider a three month period (March-April-May) and that implies without any quantitative work that March-April were more cooler-than-average. Pull back slightly further to the year-to-date rankings201301-201305and here you see that the Southeastern USA and in fact most of the USA and even Alaska have been right at the climatological normal (which for NCDC is the average temperature from 1981-2010). The short story is that North Carolina below average temperatures for the period from January to May, March to May or just plain old May are not indicative of global temperatures. The real question is why?

Global carbon emissions increased in 2012

Unlike the somewhat misleadingly rosy picture painted by President Obama about (USA) carbon emissions in his Inaugural Address and his State of the Union speech in 2013, the global carbon emissions are what matter. So if the USA continues to mine coal and ship it elsewhere, it is not an improvement except for the USA emissions portfolio. It’s like a gambler who doesn’t count losses at casinos other than the one he or she is sitting at. The International Energy Agency released a report stating that global carbon emissions are up 1.4%.bluemarble.eastI haven’t read the IEA report, but I came across the press release via the excellent energy/economy reporting they are doing. Then I heard the same WA Post reporter on the Diane Rehm show this morning (available for mp3 download via ITunes, for example). Then I read about the IEA article on Climate Central. Whew!
The Diane Rehm show had a good panel, with a requisite global warming “skeptic” (whatever that means!). That skeptic role was played by an analyst from The Heritage Foundation*. The other roles on the panel were the Post journalist, an analyst at the Environmental Defense Fund**, and a research scientist from Rutger’s University***. I would say that Diane Rehm handled the panel well, and I think that the Heritage Foundation representative overplayed his hand to the point where his comments were generally made irrelevant. In other words, he spoke too much and too glibly (is that a word) and made points that undermined his real argument that adaptation may be the most likely pathway (which is actually kind of interesting). The other panelist laid into the sillier points that the skeptic made and shut him down. Rehm left it that way.

Shutting down those punchline-style quips (memes) is really how the discussion should be every time. The Earth is warming. CO2 and other greenhouse gas concentrations continues to rise. The conversation should be about how it is our civilization needs to adapt and change. This is what the IEA discusses. Mitigation of carbon emissions is a huge discussion in the science journals. The IEA report is highlighting that we as a civilization are heading towards a major point in our hunger for fossil fuel based energy. This hunger has been targetted by scientist since the 1980s and arguably since the late 1800s! Think about solutions and strategies when you are thinking of how you want to make an impact on your community or your country or even the world. Think about our Earth and our future. The world needs you.

*The Heritage Foundation webpage states: Founded in 1973, The Heritage Foundation is a research and educational institution—a think tank—whose mission is to formulate and promote conservative public policies based on the principles of free enterprise, limited government, individual freedom, traditional American values, and a strong national defense.

**The Environmental Defense Fund webpage states: We are passionate, pragmatic environmental advocates who believe in prosperity and stewardship. Grounded in science, we forge partnerships and harness the power of market incentives.

***Dr. Jennifer Francis is deeply involved in improving our understanding of how the Arctic affects the USA – see google scholar or video of her talking about her work

Cold spring and signs of summer

A great description of some of the unusual recent temperature swings in the north central part of the USA by Minnesota State Climatologist office with the original link here:

A taste of summer air surged into Minnesota on May 14th, sending the mercury soaring into the 80s and 90s across a good part of the state. A few locations even cracking 100 degrees. Notable exceptions were locations near ice covered lakes in northern Minnesota and near Lake Superior. At 2pm May 14th, the air temperature was 102 degrees at St. James and 44 degrees at Grand Marais. This kind of temperature range happens occasionally in the spring. One of the more dramatic episodes in recent years was May 19, 2009 when there was a difference of 66 degrees from Grand Marias to Granite Falls. The warmest temperatures found from a National Weather Service Cooperative site was 103 degrees from Sherburne 3 WSW in Martin County and Winnebago in Faribault County. Amboy also had reading of 102 degrees. Extremely dry air was in place as well, with desert-like relative humidity readings in the single digits at St. James. At 2pm while it was 102 degrees at St. James, the dew point temperature was only 28 degrees, creating a relative humidity of seven percent. Very low relative humidity readings happen on occasion. On April 28, 2004 the relative humidity dipped to just 2% at Pipestone. The lowest relative humidity reading ever recorded in the Twin Cities is 10% measured at 5pm April 22, 1953. The statewide hottest maximum temperature for the entire month of May is 112 degrees measured at Maple Plain in Hennepin County on May 31,1934. The Twin Cities had a high temperature of 98 degrees on May 14. This broke the old record high of 95 degrees that was set in 1932. This is also the hottest temperature recorded so early in the season for the Twin Cities. Ironically, despite how cool it has been this spring, 2013 had its first 90 plus degree day in the Twin Cities four days earlier than 2012, which hit 93 on May 18.

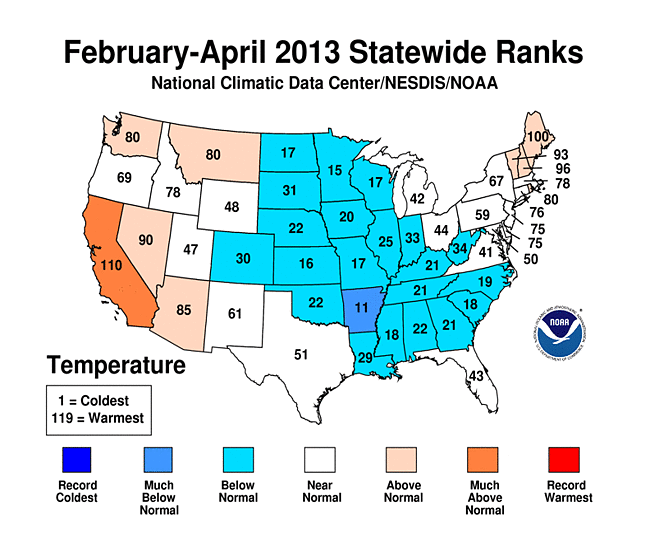
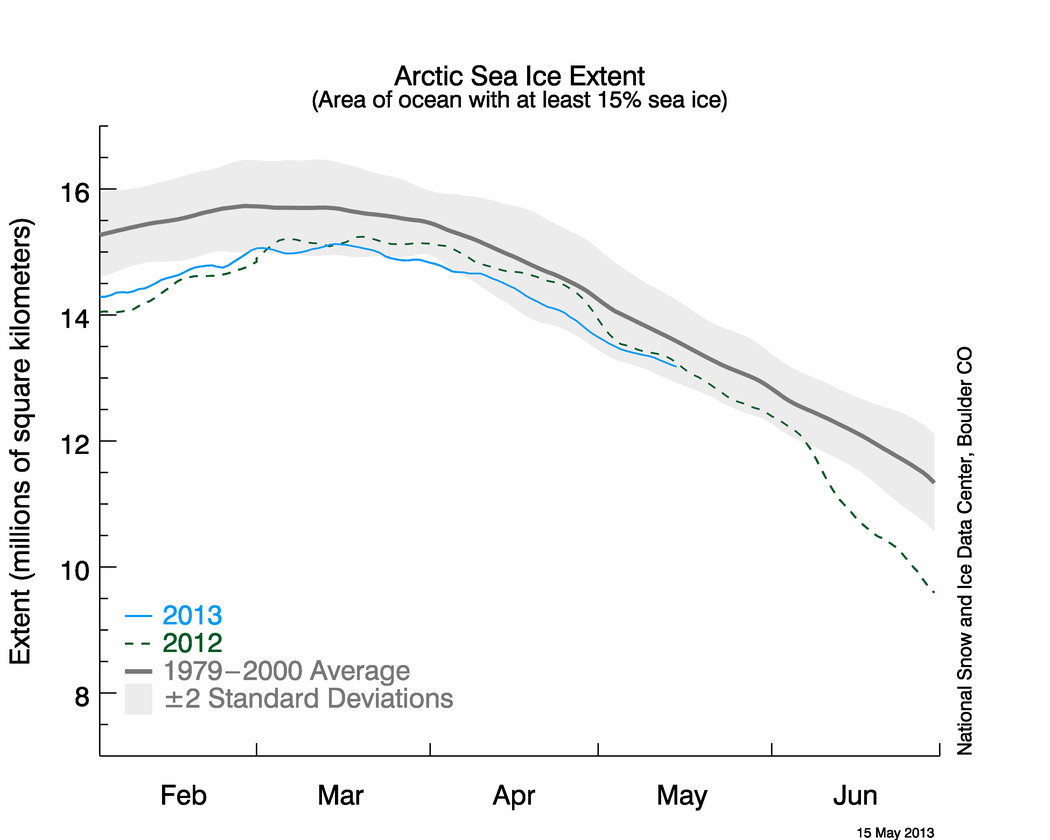
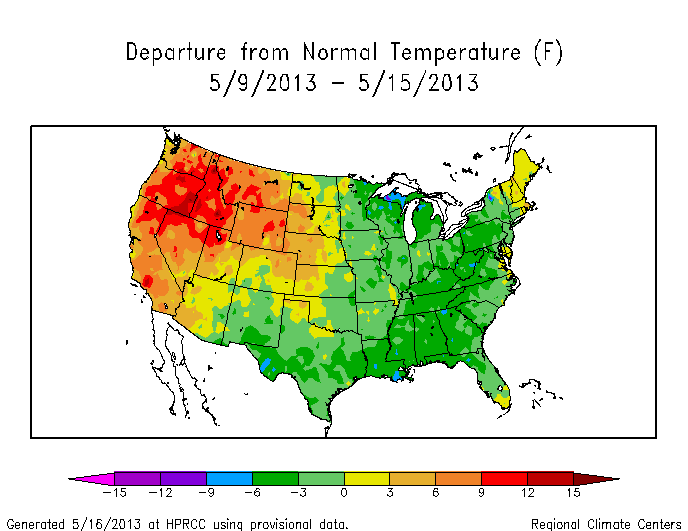
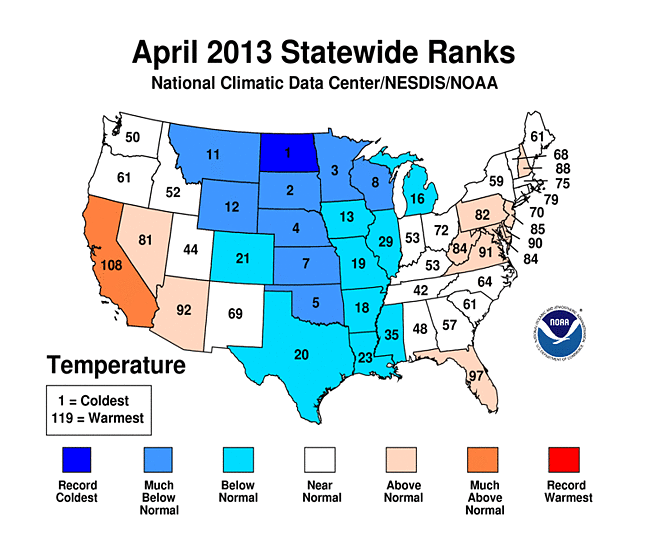
That last line is a pretty interesting weather tidbit, noting that the salient graphs from NCDC are below201304201302-201304 North Dakota had its coldest April in 119 years! Yow. Most of the central part of the country was colder than average, but by comparing the April 2013 to the multimonth average February-April 2013 plot, you can see signs of the transition out of spring to summer as well as parts of the country which had an above-average warm month (California, mid-Atlantic, Nevada, Arizona). More about this later – but these “extremes” are exactly the kind of weather we can expect as the Arctic warms or stays warmer than usual due to less sea ice. N_stddev_timeseries-2013-05The Sun will eventually win this battle and the mid-latitudes (southern USA) will inevitably heat up this year (at least I think so!). Here’s the temperature departure for the last week from HPRCC which clearly shows relatively warm temperatures creeping from the Pacific Northwest into the heretofore frozen Great Plains. 7dTDeptUS-2013-05-16 Summer is coming. Will Summer 2013 be like Summer 2012? Another question for another day.