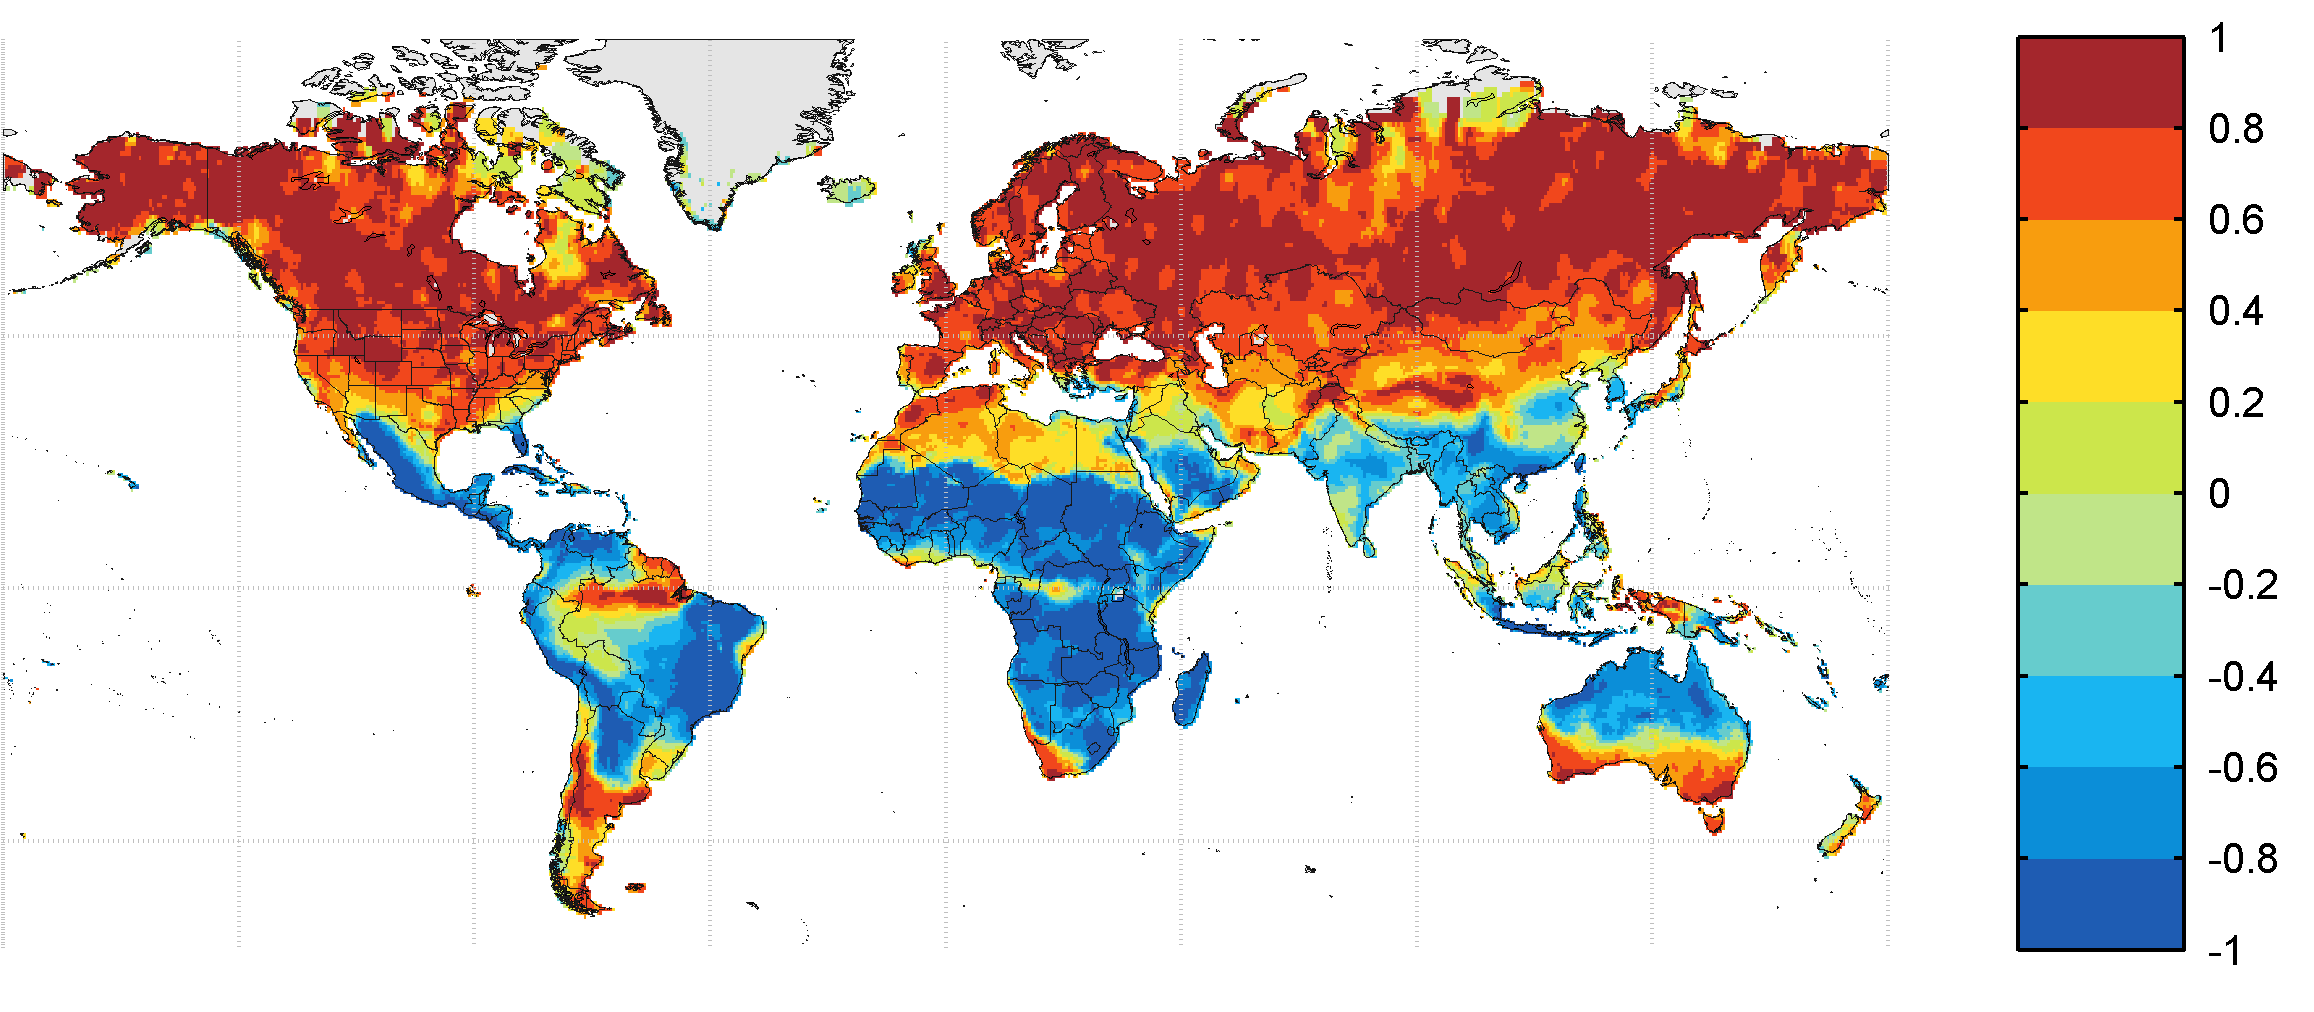
Figure 1. Where the fire and lightning seasons align, and where they do not. Values on the colorbar are the correlation coefficient calculated using mean monthly fire counts versus lightning counts for each location.
I first started working on fire-related data during my PhD research when I studied the emissions, radiative impacts, and seasonality of fires in southern Africa. Southern Africa accounts for 35-40% of all fires on our planets every year, so studying that region set me up to tackle work related to global fire for well over a decade. In about 2020, I started changing gears to focus on research related to air quality and climate but below is my brief retrospective on what I learned about global fires and lightning and humans.
Part of what interested me and still interests me about global fires was that in any given year, our planet has over 3 million fires with over 250 million lightning strikes but research shows that lightning only accounts for about 10% of all those fires. What about the other 90%? Those are set by humans, similar to the fire in Figure 2 below.
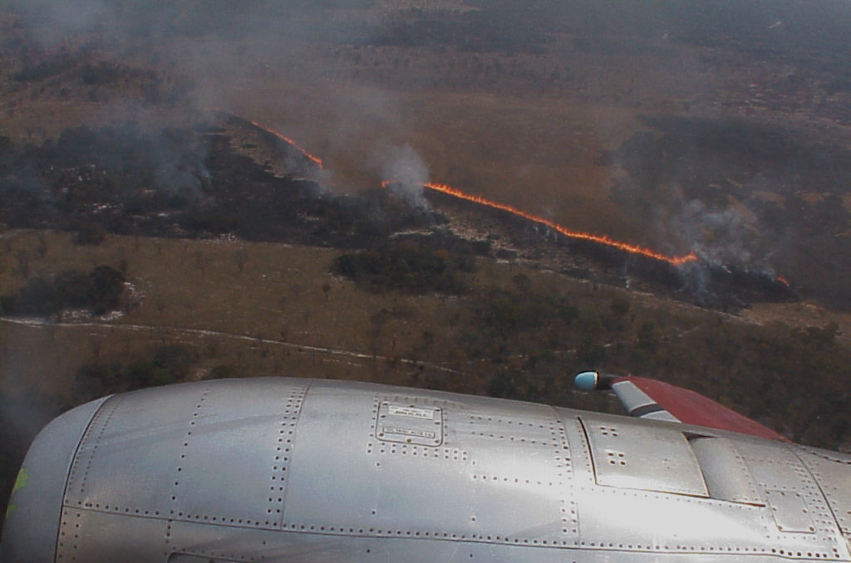
Figure 2. Fire in Zambia ignited to manage the landscape; Photo by Peter Hobbs, but I was on that SAFARI-2000 research flight too!
So have humans altered the fire season that much? Related to that, for me anyway, was the question of quantifying the human “fingerprint” on the fire season. I worked on this in several different ways, often using satellite based fire data from NASA, and culminating in work I published in peer-reviewed journals such as “A fire model with distinct crop, pasture, and non-agricultural burning: use of new data and a model-fitting algorithm for FINAL.1.” and “Separating agricultural and non-agricultural fire seasonality at regional scales“. This work was mostly with ecologists, and I approached it with my background in working with satellite remote sensing data.
Following a different approach, I worked to study the human-fire connection with colleagues who had expertise in anthropology and we published “A Global Analysis of Hunter-Gatherers, Broadcast Fire Use, and Lightning-Fire-Prone Landscapes“. Our global analysis of human-fire-landscape interaction in 339 hunter-gatherer groups demonstrated that lightning-fire-prone environments strongly predicted for hunter-gatherer fire use. From this, we posited that even though a lightning-fire prone environment may invite the use of fire, a conspicuous divergence from expected fire-lightning patterns might not be the clear litmus for human-fire-landscape interaction that many in global fire research (including myself!) hope. In other words, it’s a muddy inference either way.
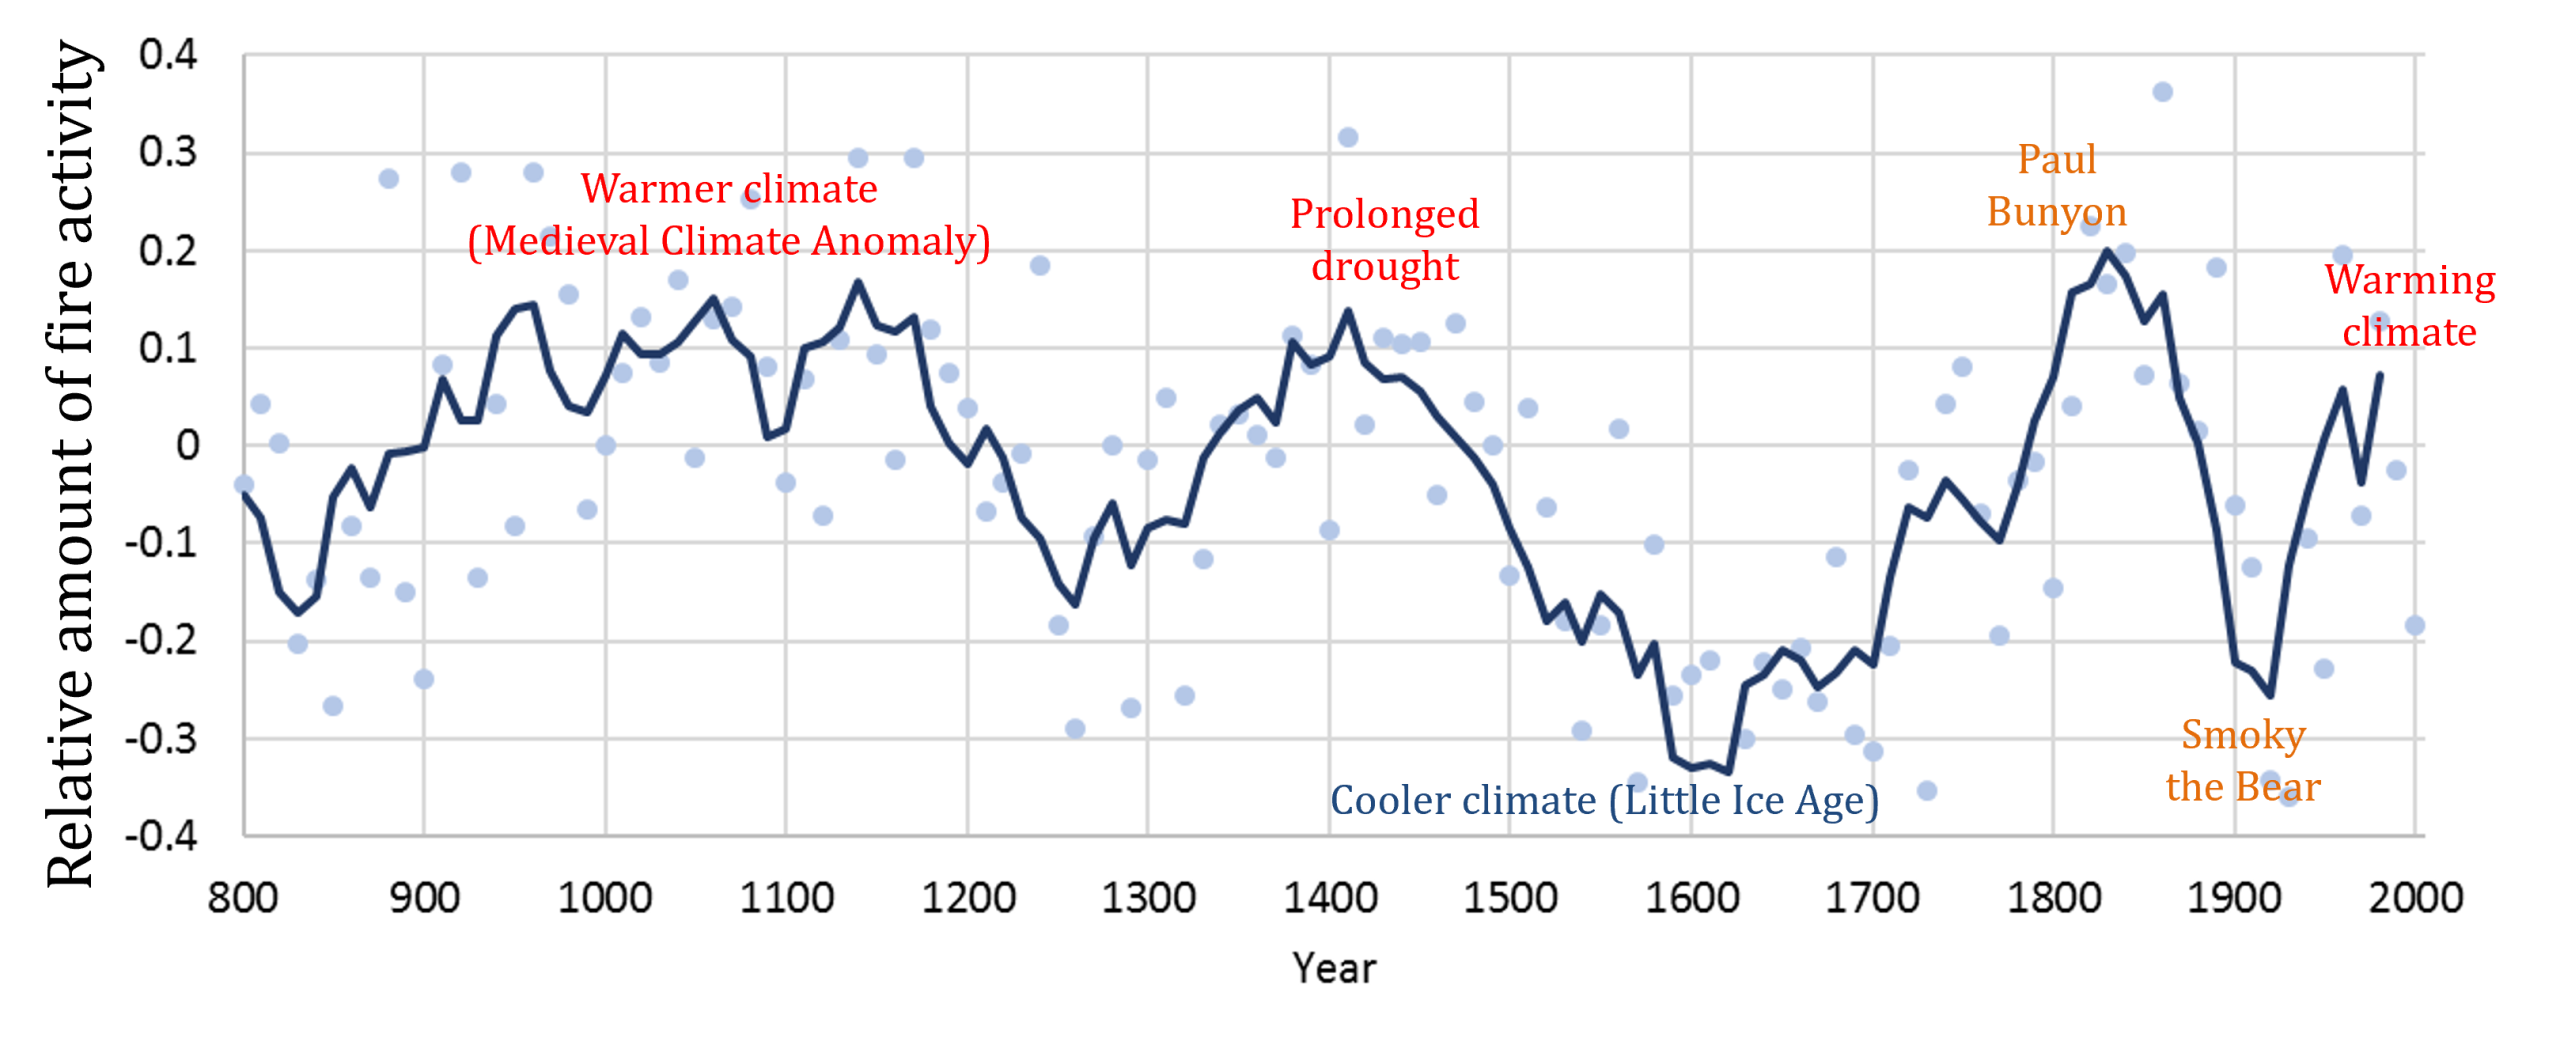
Figure 3. Fire activity in Western North America over the Past 1200 years, where blue points are from lake sediment cores. I made the graphic using results from Marlon et al. 2016 “Reconstructions of biomass burning from sediment-charcoal records to improve data–model comparisons”.
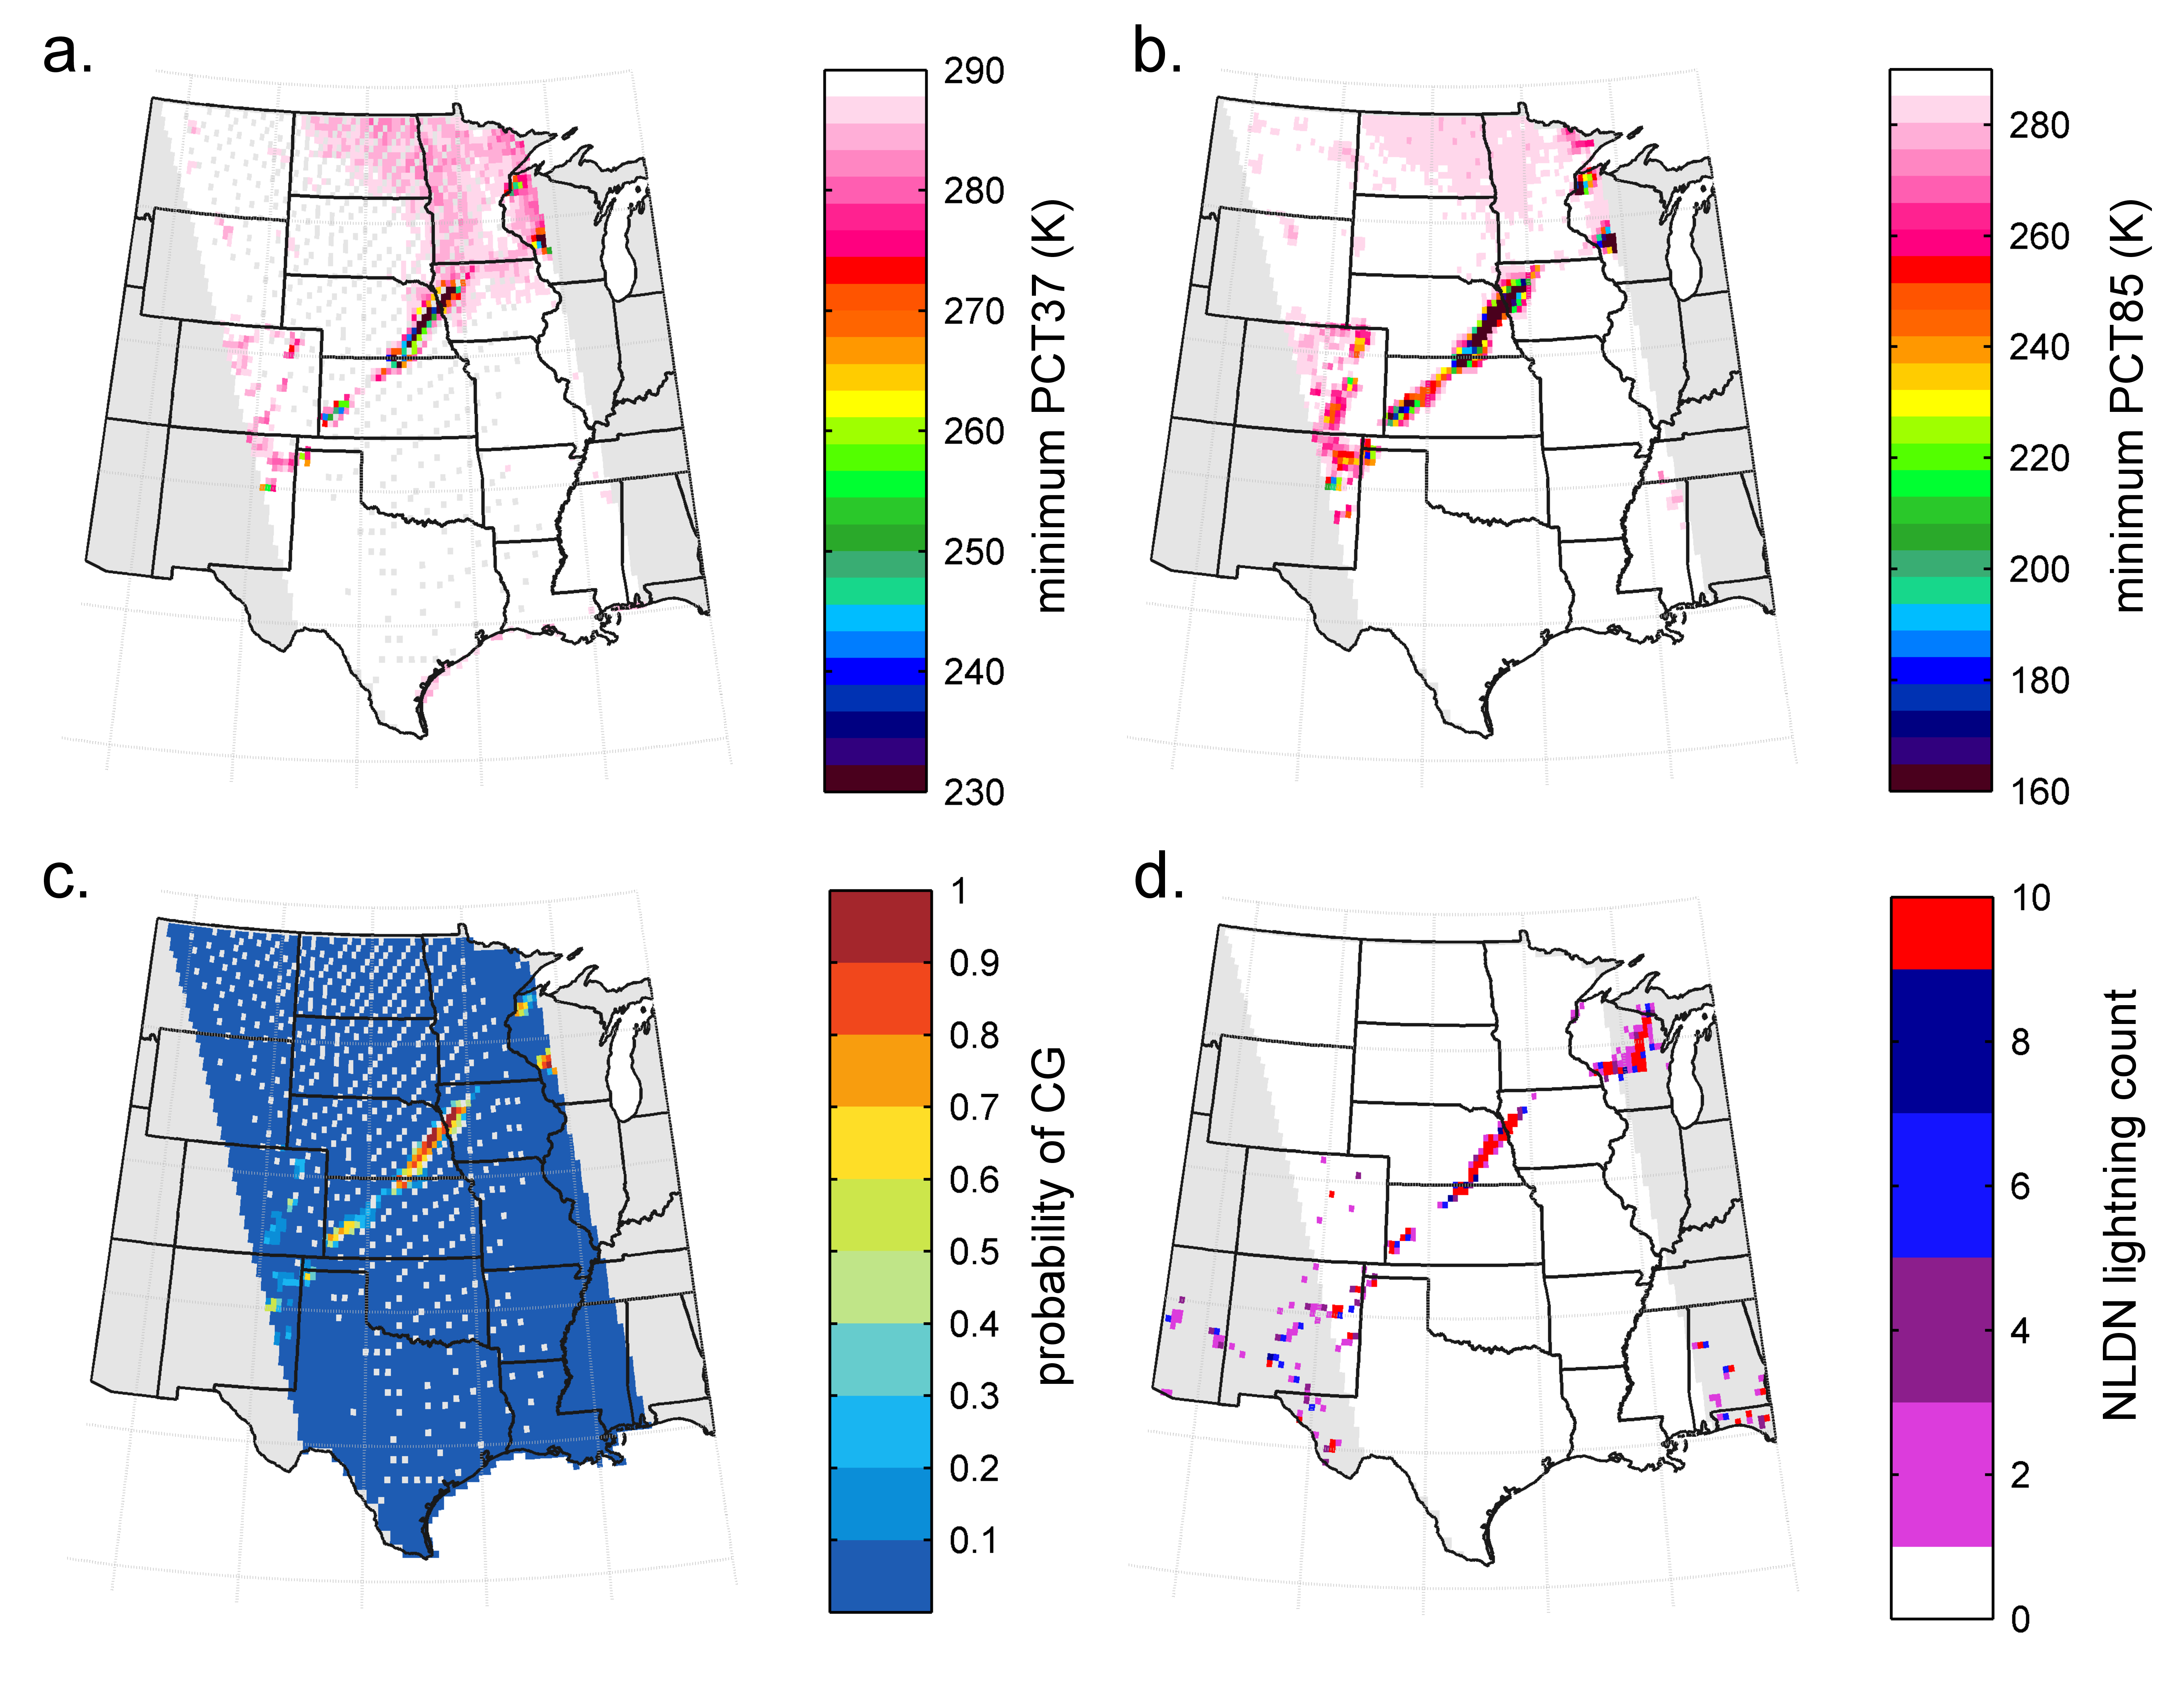
Figure 4. Microwave remote sensing data from SSMI and lightning from NLDN
One way I worked on understanding the role of lightning (desperately trying to return to my atmospheric sciences roots) was to use microwave data from satellite-based sensor. In Figure 4, you can see how the patterns of ground-based lightning detections (Figure 4d) are tantalizingly similar to microwave data at two different frequencies (Figures 4a-b). Why does this similarity arise? Well, if you study atmospheric sciences and cloud microphysics, then you know the key element that results in highly-electrified clouds is ice. Ice is largely invisible at microwave frequencies so ice appears as a “hole” in imagery where there ice-laden thunderstorms. I worked on this angle and trained an approach to calculate the probability of a cloud-to-ground lightning strike in Figure 4c.
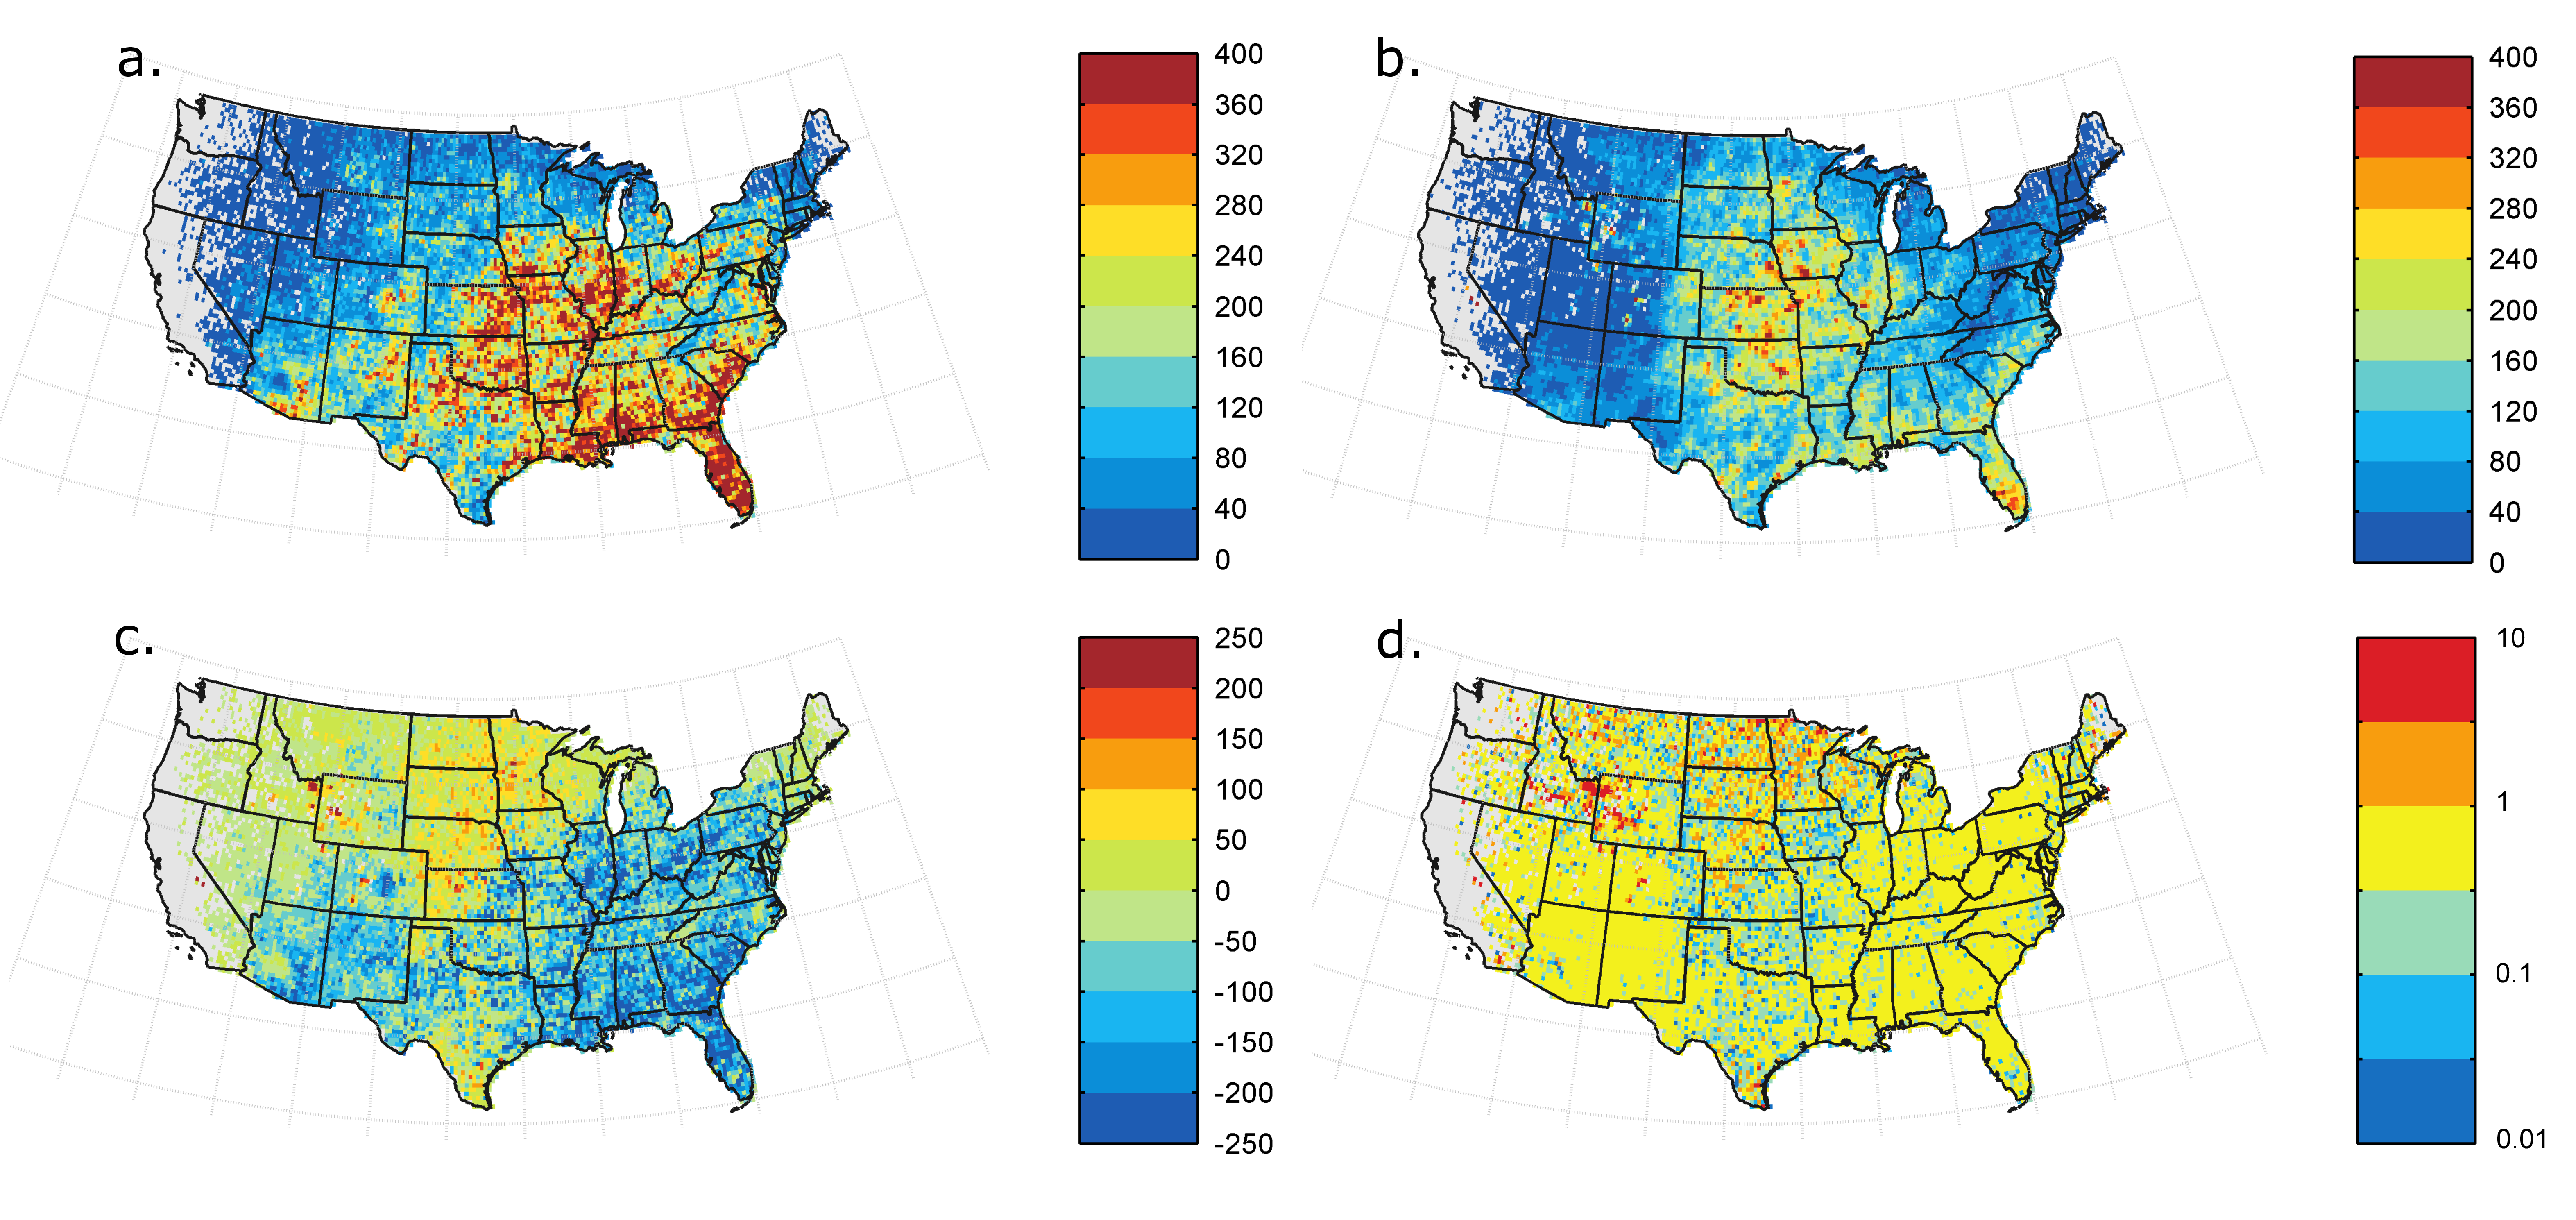
Figure 5. USA lightning from (a.) NLDN, (b.) SSMI, and shown as a (c.) Difference, and (d.) Percent difference
Now I’m not going to say this is perfect way to find lightning, but I worked on this because we have microwave data from satellites that extends back to the late 1970s, which could have helped form the basis for a deeper observational history of documenting where lightning happened and maybe how it has changed. Right now, our observations of lightning extend back to the late 1990s, so that would be an extra 20 years of lightning observations. This in turn could have linked to fire research. I do wish I could have worked on this more but ran out of bandwidth and time. My goal was to try and use this data to extend lightning data back another 15-20 years.
Lots of people I worked with on fire research continue to hack away at the frustratingly complex problem, looking for intersections amongst different sources of data and fire/climate modeling and trying to determine where synthesis might emerge. This is what a scientific problem can do though. We love hard-to-solve puzzles.